A study of 12 donors that measures 300 cells of a cell type in each donor has 12 replicates of that cell type, not 3,600. Cells of one donor share its genotype, its environment and the handling of its sample, so they resemble each other more than they resemble the cells of other donors. A test that treats the cells as replicates measures a difference against a standard error that shrinks with every cell sampled, and calls differences that other donors do not share Squair et al., 2021Zimmerman et al., 2021. Pooling the cells of each sample and cell type into one profile, a pseudobulk profile, makes the sample the unit of every test: a difference is then measured against the variation between donors, with the methods that bulk RNA-seq developed for it.
This page shows the problem on a comparison in which nothing differs, then what benchmarks and studies of replication found.
A comparison in which nothing differs
The control samples of the simulated PBMC study come from 12 donors who were treated alike (Datasets). Split at random into two groups of six, they differ in no gene, beyond the small shift that the simulation gives every gene of each donor, in all of the donor’s cells, as real donors differ. Every gene of a cell type is tested between the two groups in two ways:
Cells as replicates: Welch’s t-test on the log-normalized values of the cells, the test that scanpy’s
rank_genes_groupsruns by default Wolf et al., 2018. The cube holds what it needs: the cells of each group’s samples, pooled byCube.collapse_samples, give the mean and the variance of the cells’ values (Cube.mean,Cube.variance).Samples as replicates:
limma_voomon the pseudobulk profiles of the 12 samples.
import matplotlib.pyplot as plt
import numpy as np

import cytepool
from cytepool.design import Design
from cytepool.differential_expression import limma_voom
from cytepool.io import read_cube
from cytepool.plotting import plot_p_values
from cytepool.stats.distributions import t_sf
from cytepool.stats.multiple_testing import adjust_p_values

cube = read_cube("simulated_pbmc.cube.zarr")
controls = cube.select(samples=cube.samples["condition"] == "ctrl")
donors = controls.samples["donor"]
in_a = np.isin(donors, np.random.default_rng(1).permutation(donors)[:6])
print(f"CytePool {cytepool.__version__}")
print("group A:", ", ".join(donors[in_a]))
print("group B:", ", ".join(donors[~in_a]))


def pooled_cells(cube, group, samples):
    # The cells of some samples of one cell type: how many, and the mean and
    # variance of every gene's log-normalized values. Every control sample has the
    # condition ctrl, so pooling by condition pools them all.
    pooled = cube.select(samples=samples, groups=group).collapse_samples("condition")
    return pooled.n_cells[0, 0], pooled.mean(group)[0], pooled.variance(group)[0]


def test_of_cells(cube, group, in_a):
    # Welch's t-test of every gene between the cells of two sets of samples.
    (n_a, mean_a, var_a), (n_b, mean_b, var_b) = (
        pooled_cells(cube, group, samples) for samples in (in_a, ~in_a)
    )
    se2_a, se2_b = var_a / n_a, var_b / n_b
    t = (mean_a - mean_b) / np.sqrt(se2_a + se2_b)
    df = (se2_a + se2_b) ** 2 / (se2_a**2 / (n_a - 1) + se2_b**2 / (n_b - 1))
    return 2 * t_sf(np.abs(t), df)


design = Design(
    controls.samples.with_columns(group=np.where(in_a, "A", "B")),
    "~ group",
    levels={"group": ["A", "B"]},
    contrasts={"B_vs_A": "groupB"},
)
of_samples = limma_voom(controls, design)

cd4 = "CD4 T cells"
figure, (left, right) = plt.subplots(
    1, 2, figsize=(12, 3.8), layout="constrained", sharey=True
)
plot_p_values(test_of_cells(controls, cd4, in_a), ax=left)
left.set_title("CD4 T cells, cells as replicates")
plot_p_values(of_samples.table(cd4, "B_vs_A"), ax=right)
right.set_title("CD4 T cells, samples as replicates")
plt.show()
CytePool 0.1.dev57+gb65bc7e32
group A: D01, D05, D06, D08, D09, D12
group B: D02, D03, D04, D07, D10, D11
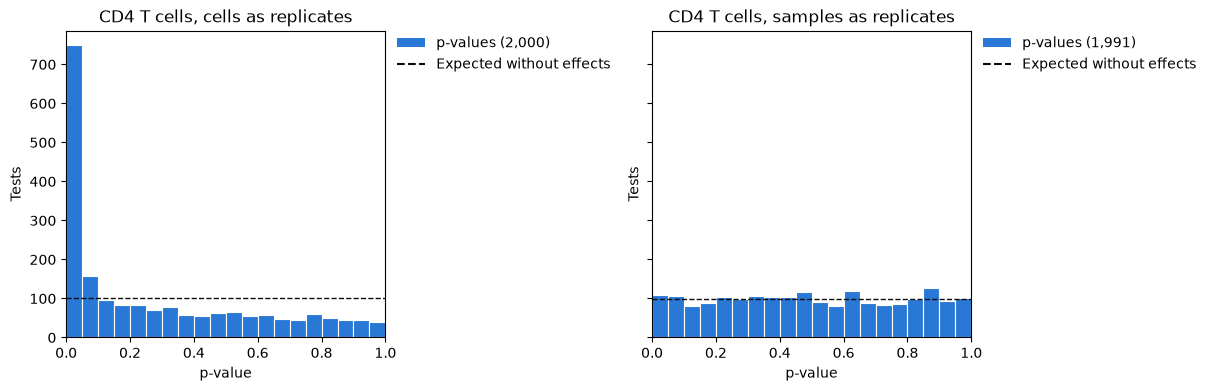
Without a difference, p-values are spread evenly between 0 and 1, and each bin of the histogram holds about as many genes as the dashed line. The test of the samples gives that. The test of the cells gives p-values below 0.05 to more than a third of the genes, every one of them a false positive.
More cells, more false discoveries
The same two tests in every cell type, with the genes each calls at a false discovery
rate of 5% (adjust_p_values, as Benjamini and Hochberg’s method adjusts them):
print(f"{'cell type':<16}{'cells':>7}{'calls, cells':>14}{'calls, samples':>16}")
for group, n in zip(controls.groups["group_id"], controls.n_cells.sum(axis=0)):
    by_cells = np.sum(adjust_p_values(test_of_cells(controls, group, in_a)) < 0.05)
    by_samples = np.sum(of_samples.table(group, "B_vs_A")["adjusted_p_value"] < 0.05)
    print(f"{group:<16}{n:>7,}{by_cells:>14,}{by_samples:>16,}")
cell type cells calls, cells calls, samples
B cells 1,161 203 0
CD4 T cells 3,097 553 0
CD8 T cells 1,412 288 0
NK cells 1,114 153 0
Monocytes 2,533 442 0
Dendritic cells 191 6 0
Every call is false. The test of the samples makes none, and the test of the cells makes hundreds in every cell type with many cells, more the more cells it is given: the dendritic cells, about 16 in each sample, have the fewest calls.
Why the test of the cells fails
Take the gene of the CD4 T cells that the test of the cells finds most significant, and draw the mean of every donor’s cells, and the mean of each group’s cells with the 95% confidence interval that the test of the cells gives it:
p_cells = test_of_cells(controls, cd4, in_a)
gene = int(np.argmin(p_cells))
name = controls.features["feature_id"][gene]
table = of_samples.table(cd4, "B_vs_A")
p_samples = table["p_value"][table["feature_id"] == name][0]
print(
    f"{name}: p-value {p_cells[gene]:.0e} testing cells, {p_samples:.2f} testing samples"
)

pooled = [pooled_cells(controls, cd4, samples) for samples in (in_a, ~in_a)]
figure, ax = plt.subplots(figsize=(6.5, 4))
ax.scatter(
    np.where(in_a, 0, 1),
    controls.mean(cd4)[:, gene],
    color="0.45",
    label="Mean of a donor's cells",
)
ax.errorbar(
    [0.15, 1.15],
    [mean[gene] for _, mean, _ in pooled],
    yerr=[1.96 * np.sqrt(variance[gene] / n) for n, _, variance in pooled],
    fmt="o",
    color="tab:red",
    capsize=5,
    label="Mean of a group's cells, 95% interval",
)
ax.set_xticks([0, 1], ["Group A", "Group B"])
ax.set_xlim(-0.5, 1.6)
ax.set_ylabel("Mean log-normalized value")
ax.set_title(f"{name} in the CD4 T cells")
ax.legend(frameon=False)
plt.show()
gene_1915: p-value 4e-27 testing cells, 0.02 testing samples
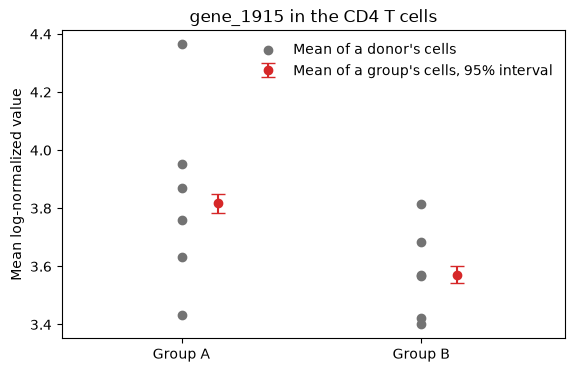
The donors of one group differ from each other more than the two groups differ. The test of the cells measures the difference against the precision of each group’s mean over some 1,500 cells, the red intervals: that precision says how well these 12 donors were measured, not how another 12 donors would differ. The test of the samples measures the same difference against the spread of the donors, and its p-value of 0.02 is no discovery among 2,000 genes.
What benchmarks found
Studies that compared methods on data whose truth was known report:
Squair et al. (2021) compared differential expression methods on eighteen datasets with matched bulk RNA-seq. Methods that ignore the variation between biological replicates were biased and prone to false discoveries, and the most widely used methods could discover hundreds of differentially expressed genes in the absence of biological differences.
Zimmerman et al. (2021) showed that cells of one individual are not statistically independent and that ignoring it leads to highly inflated type 1 error rates. They proposed mixed models with a random effect for the individual, and found pseudobulk methods conservative and underpowered in comparison.
Murphy & Skene (2022) reran that benchmark with the Matthews correlation coefficient, a measure that balances false positives and false negatives, and found that pseudobulk methods performed best.
Junttila et al. (2022) compared 18 methods for differential states between conditions in data of several subjects: pseudobulk methods performed generally best, and methods that treat cells as independent were more sensitive but gave many false positives.
Crowell et al. (2020) surveyed cell-level mixed models and methods on pseudobulk data for differential state analysis, with a simulation of single-cell data of several samples and conditions.
Results that replicate
Results that rest on cells as replicates include many that a test of donors does not find, and even results that compare donors replicate less often than their p-values suggest:
Murphy et al. (2023) re-analysed the first single-nucleus study of Alzheimer’s disease. A pseudobulk analysis of the authors’ processed data found 26 differentially expressed genes at a false discovery rate of 0.05, 549 times fewer than the 14,274 of the analysis of cells.
Nakatsuka et al. (2025) found that over 85% of the Alzheimer’s disease genes called in one of 17 datasets, with pseudobulk tests, failed to reproduce in any of the 16 others, and that a meta-analysis of ranks across datasets found genes that predicted disease better.
Garg et al. (2021) re-analysed COVID-19 single-cell studies in a standard way and confirmed 8 of 20 published results across datasets.
Pooling the cells removes the false positives of pseudoreplication. Small studies and differences between cohorts remain, which combining studies addresses (Meta-analysis).
Choices
Pool, then test.
from_cellspools the cells of every sample and cell type (Pool cells into pseudobulk profiles), and the tests of Compare conditions compare the profiles.Profiles of few cells. A profile of a handful of cells is noisy:
min_cells(10 by default) leaves such profiles out of a fit, andprior_weights="n_cells"instead weights every profile by its number of cells Hoffman et al., 2026.Several samples of a donor. They are not independent either: pair them in the design,
~ donor + condition, or give the donor a random effect withdream_voom(Repeated measures and donors).Models of the cells. Generalized linear mixed models with a random effect for each individual model the cells themselves Zimmerman et al., 2021; CytePool does not fit them.
Descriptions of the cells. What fraction of a cell type’s cells express a gene, and how much, describe the cells and need no test: the dot plot draws them from the cube (Pool cells into pseudobulk profiles).
- Squair, J. W., Gautier, M., Kathe, C., Anderson, M. A., James, N. D., Hutson, T. H., Hudelle, R., Qaiser, T., Matson, K. J. E., Barraud, Q., Levine, A. J., La Manno, G., Skinnider, M. A., & Courtine, G. (2021). Confronting false discoveries in single-cell differential expression. Nature Communications, 12(1), 5692. 10.1038/s41467-021-25960-2
- Zimmerman, K. D., Espeland, M. A., & Langefeld, C. D. (2021). A practical solution to pseudoreplication bias in single-cell studies. Nature Communications, 12(1), 738. 10.1038/s41467-021-21038-1
- Wolf, F. A., Angerer, P., & Theis, F. J. (2018). SCANPY: large-scale single-cell gene expression data analysis. Genome Biology, 19(1), 15. 10.1186/s13059-017-1382-0
- Murphy, A. E., & Skene, N. G. (2022). A balanced measure shows superior performance of pseudobulk methods in single-cell RNA-sequencing analysis. Nature Communications, 13(1), 7851. 10.1038/s41467-022-35519-4
- Junttila, S., Smolander, J., & Elo, L. L. (2022). Benchmarking methods for detecting differential states between conditions from multi-subject single-cell RNA-seq data. Briefings in Bioinformatics, 23(5), bbac286. 10.1093/bib/bbac286
- Crowell, H. L., Soneson, C., Germain, P.-L., Calini, D., Collin, L., Raposo, C., Malhotra, D., & Robinson, M. D. (2020). muscat detects subpopulation-specific state transitions from multi-sample multi-condition single-cell transcriptomics data. Nature Communications, 11(1), 6077. 10.1038/s41467-020-19894-4
- Murphy, A. E., Fancy, N., & Skene, N. (2023). Avoiding false discoveries in single-cell RNA-seq by revisiting the first Alzheimer’s disease dataset. eLife, 12, RP90214. 10.7554/eLife.90214
- Nakatsuka, N., Adler, D., Jiang, L., Hartman, A., Cheng, E., Klann, E., & Satija, R. (2025). Improving reproducibility of differentially expressed genes in single-cell transcriptomic studies of neurodegenerative diseases through meta-analysis. Nature Communications, 16(1), 7436. 10.1038/s41467-025-62579-z
- Garg, M., Li, X., Moreno, P., Papatheodorou, I., Shu, Y., Brazma, A., & Miao, Z. (2021). Meta-analysis of COVID-19 single-cell studies confirms eight key immune responses. Scientific Reports, 11(1), 20833. 10.1038/s41598-021-00121-z
- Hoffman, G. E., Lee, D., Bendl, J., Prashant, N. M., Hong, A., Casey, C., Alvia, M., Shao, Z., Argyriou, S., Therrien, K., Venkatesh, S., Voloudakis, G., Haroutunian, V., Fullard, J. F., & Roussos, P. (2026). Efficient differential expression analysis of large-scale single-cell transcriptomics data using Dreamlet. Nature Communications, 17(1), 9597. 10.1038/s41467-026-75680-8