Tests of conditions compare samples, so the cells of every sample and cell type are
first pooled into one profile (Why pseudobulk). A cube keeps
those profiles: for every gene, sums over the cells of each sample and cell type, with
the number of cells pooled into each. Because every value is a sum, cell types can be
merged and samples pooled later without the cells, and the same sums give what
describes the cells: the fraction that express each gene and their mean expression, the
values of a dot plot. This page pools the cells of the simulated PBMC
study (the simulated_pbmc dataset of the Datasets page),
looks at the markers of its cell types and at its samples, and merges a rare cell type
into its lineage. The cube and its additive layers defines
every layer.
Samples, cell types and layers
from_cells takes a cells x genes matrix of counts and the sample and the cell
type of every cell. A sample table, with a sample_id for every sample label, sets the
order of the samples and carries the variables that designs use, here the donor and the
condition; a group table does the same for the cell types, and may carry their lineage.
import matplotlib.pyplot as plt
import numpy as np
import scipy.sparse

import cytepool
from cytepool.cube import from_cells
from cytepool.plotting import plot_cell_numbers, plot_dotplot, plot_pca

cells = np.load("simulated_pbmc_cells.npz")
counts = scipy.sparse.csr_array(
    (cells["data"], cells["indices"], cells["indptr"]), shape=tuple(cells["shape"])
)
sample_ids = np.unique(cells["cell_sample"])
cube = from_cells(
    counts,
    samples=cells["cell_sample"],
    groups=cells["cell_type"],
    sample_table={
        "sample_id": sample_ids,
        "donor": [sample.split("_")[0] for sample in sample_ids],
        "condition": [sample.split("_")[1] for sample in sample_ids],
    },
    group_table={
        "group_id": cells["cell_types"],
        "lineage": ["lymphoid"] * 4 + ["myeloid"] * 2,
    },
    features=cells["feature_id"],
)
print(f"CytePool {cytepool.__version__}")
print(cube)
print(cube.groups)
CytePool 0.1.dev61+g194f49f8f
Cube with 24 samples x 6 groups x 2,000 features
layers: counts (uint32), detected (uint32), log_sum (float64), log_sum_sq (float64), linear_sum (float64)
filled: 144 of 144 sample x group entries have cells (100.0%)
samples: sample_id, donor, condition
groups: group_id, lineage
features: feature_id
Table with 6 rows and 2 columns
group_id lineage
str str
B cells lymphoid
CD4 T cells lymphoid
CD8 T cells lymphoid
NK cells lymphoid
Monocytes myeloid
Dendritic cells myeloid
The cube holds five layers: the counts, which the tests read, and four that describe
the cells: detected, the number of cells with a positive count, and the sums of the
cells’ log-normalized values (log_sum), of their squares (log_sum_sq) and of the
normalized values themselves (linear_sum). Each cell is normalized to 10,000 counts
and log-transformed, as scanpy’s normalize_total and log1p do.
The markers of each cell type
A dot plot shows, for chosen genes and cell types, the fraction of the cells that
express each gene, as the area of a dot, and their mean expression, as its colour, as
scanpy draws it Wolf et al., 2018. plot_dotplot reads both from the cube, pooled over
every sample, and gives the values scanpy computes from the cells
(Validation). The simulation
gave each cell type 20 marker genes; here are three of each, with the means of each
gene scaled from 0 to 1 over the cell types, as scanpy’s standard_scale="var" scales
them.
markers = {
    cell_type: list(genes[:3])
    for cell_type, genes in zip(cells["cell_types"], cells["marker_genes"])
}
ax = plot_dotplot(cube, markers, standard_scale="gene")
plt.show()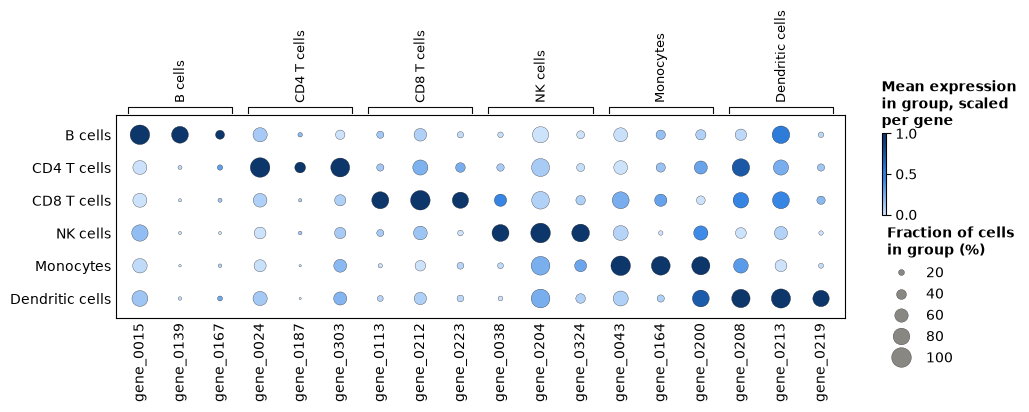
Each cell type’s markers are expressed in more of its cells, and more highly, than in the other cell types, as an annotation that is right shows them. A cell type whose markers light up in another row is worth a second look before any test.
What changes in the cells
Cube.collapse_samples pools the samples that share a value of a sample column,
here the condition: the profiles of the 12 control samples are summed into one, and so
are those of the 12 stimulated ones. From the pooled sums, Cube.fraction_detected,
Cube.mean and Cube.variance give the fraction of the cells that detect
each gene, and the mean and the variance of their log-normalized values. For one gene
of the response program that the simulation gave every cell type:
by_condition = cube.collapse_samples("condition")
print(by_condition.samples)

gene = cube.features["feature_id"].tolist().index("gene_0191")
detected = by_condition.fraction_detected()[:, :, gene]
mean = by_condition.mean()[:, :, gene]
variance = by_condition.variance()[:, :, gene]
print(f"\ngene_0191, control -> stimulated{'detected':>12}{'mean':>16}{'variance':>16}")
for g, cell_type in enumerate(by_condition.groups["group_id"]):
    print(
        f"{cell_type:<32}{detected[g, 0]:>6.2f} -> {detected[g, 1]:.2f}"
        f"{mean[g, 0]:>8.2f} -> {mean[g, 1]:.2f}{variance[g, 0]:>8.2f} -> {variance[g, 1]:.2f}"
    )
Table with 2 rows and 3 columns
sample_id condition n_pooled_samples
str str int64
ctrl ctrl 12
stim stim 12
gene_0191, control -> stimulated detected mean variance
B cells 0.86 -> 1.00 1.98 -> 3.44 0.90 -> 0.43
CD4 T cells 0.78 -> 0.99 1.59 -> 3.26 0.92 -> 0.48
CD8 T cells 0.85 -> 0.99 1.87 -> 3.50 0.91 -> 0.49
NK cells 0.74 -> 0.97 1.49 -> 2.89 0.98 -> 0.64
Monocytes 0.65 -> 0.97 1.20 -> 2.88 0.92 -> 0.60
Dendritic cells 0.75 -> 0.96 1.53 -> 2.78 0.97 -> 0.82
After the stimulation nearly every cell of every type expresses the gene, and the mean
of their log-normalized values about doubles. These pooled values describe the cells;
they are no test, since the samples pooled are the replicates a test needs (Genes that
change in each cell type tests the change). Pooling the
samples of each donor, collapse_samples("donor"), gives one profile per donor, for
questions about donors (Repeated measures and donors).
The samples of each cell type
DESeq2’s PCA plot places the samples of one cell type on the principal components of
their 500 most variable genes Love et al., 2014, prepared as for an MDS plot: profiles of
fewer than 10 cells are left out, genes are filtered by expression, and the values are
log-CPM (plot_pca, principal_components). It shows at a glance whether
the samples group as the design expects.
figure, (left, right) = plt.subplots(1, 2, figsize=(12, 4.6), layout="constrained")
plot_pca(cube, group="Monocytes", color_by="condition", ax=left)
plot_pca(
    cube,
    group="Monocytes",
    color_by="condition",
    marker_by="donor",
    components=(2, 3),
    ax=right,
)
plt.show()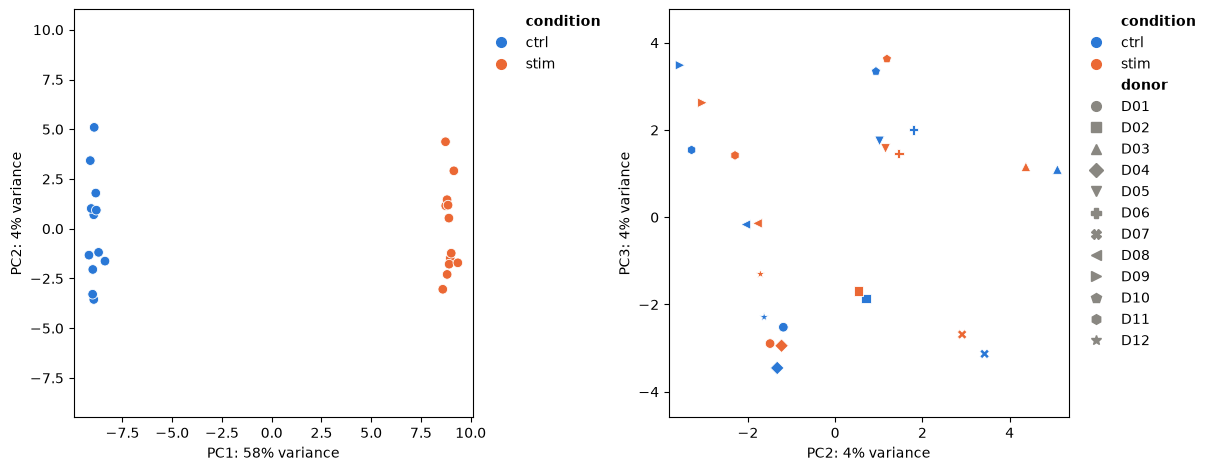
The first component, more than half of the variance, is the stimulation. On the second and third, each donor’s two samples lie near each other: donors differ, which is why the design of Genes that change in each cell type pairs them.
A cell type with few cells
Six profiles of dendritic cells pool fewer than 10 cells, and limma_voom leaves
them out of the dendritic cells’ fit (Quick start). Where a rare
cell type matters less than its lineage, Cube.regroup merges it with related
cell types: every layer of the merged cell type is the sum of its members’, as pooling
the relabelled cells would give. Here the group table’s lineage names the myeloid cell
types (Table.filter).
myeloid = cube.groups.filter(cube.groups["lineage"] == "myeloid")["group_id"]
merged = cube.regroup({"Myeloid cells": list(myeloid)})
print(merged.groups)
plot_cell_numbers(merged)
plt.show()
Table with 5 rows and 2 columns
group_id lineage
str str
B cells lymphoid
CD4 T cells lymphoid
CD8 T cells lymphoid
NK cells lymphoid
Myeloid cells myeloid
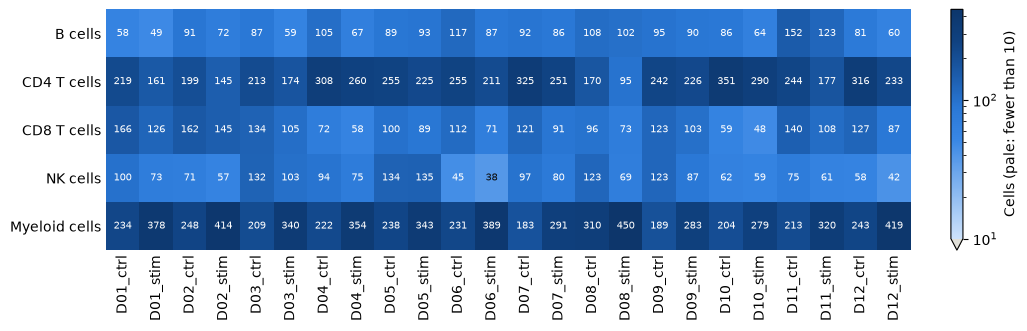
Every profile of the merged myeloid cells holds enough cells. The merged profile mixes two cell types in proportions that differ between samples, and the stimulation changes those proportions (Cell-type composition), so a change in the merged profile can come from either; testing the monocytes alone, and the dendritic cells on their 18 profiles, keeps the two apart.
Choices
Samples. A sample is a biological replicate: one donor in one condition, or one tissue of a donor. Pool technical replicates, such as lanes or libraries of the same sample, by giving them one sample label, or later with
Cube.collapse_samples.Tables. The sample and group tables take a pandas DataFrame or a mapping of columns, and a cube keeps them as
Tableobjects:Table.selectkeeps some columns,Table.filtersome rows,Table.with_columnsadds columns, such as a variable for a design, andTable.to_pandasgives a DataFrame.Cell types. Annotate at the level the question needs.
Cube.selectkeeps some cell types,Cube.regroupmerges them, and the minimum of cells (min_cellsoflimma_voom, 10 by default) leaves out the profiles of too few cells, with the reason in the result.Layers.
layers="counts"keeps only what the tests read: 4 bytes per sample, cell type and gene, against 32 for all five layers, which matters for atlases of thousands of samples. The dot plot needsdetectedandlog_sum, andCube.varianceneedslog_sum_sq.Normalization of the cells.
target_sum(10,000) sets the total that every cell is scaled to, andlibrary_sizesgives the totals when the matrix holds only some of the genes.Bulk data.
from_bulkwraps a samples x genes matrix of counts as a cube with one group, which every test of a cube takes (Bulk RNA-seq).Other tools. Cells in an AnnData, and profiles pooled by scanpy, decoupler or LIANA, become cubes too (Work with AnnData and MuData).
- Wolf, F. A., Angerer, P., & Theis, F. J. (2018). SCANPY: large-scale single-cell gene expression data analysis. Genome Biology, 19(1), 15. 10.1186/s13059-017-1382-0
- Love, M. I., Huber, W., & Anders, S. (2014). Moderated estimation of fold change and dispersion for RNA-seq data with DESeq2. Genome Biology, 15(12), 550. 10.1186/s13059-014-0550-8