Does a condition change which cells a sample holds? propeller tests the
proportion of each cell type across samples, as speckle does Phipson et al., 2022, from the
number of cells that a cube records for every sample and cell type
(Cube.n_cells); Composition tests gives the
steps. The simulated PBMC study knows the answer: 12 donors, each sampled before and
after a stimulation that multiplies the ratio of monocytes to every other cell type by
, about 2, and changes nothing else (the simulated_pbmc dataset of the
Datasets page).
import matplotlib.pyplot as plt

import cytepool
from cytepool.composition import propeller
from cytepool.design import Design
from cytepool.io import read_cube
from cytepool.plotting import plot_composition, plot_proportions

cube = read_cube("simulated_pbmc.cube.zarr")
print(f"CytePool {cytepool.__version__}")
print(cube)
plot_composition(cube, by="condition")
plt.show()
CytePool 0.1.dev54+g3f0cbb52e
Cube with 24 samples x 6 groups x 2,000 features
layers: counts (uint32, lazy), detected (uint32, lazy), log_sum (float64, lazy), log_sum_sq (float64, lazy), linear_sum (float64, lazy)
filled: 144 of 144 sample x group entries have cells (100.0%)
samples: sample_id, donor, condition, sex
groups: group_id
features: feature_id, symbol
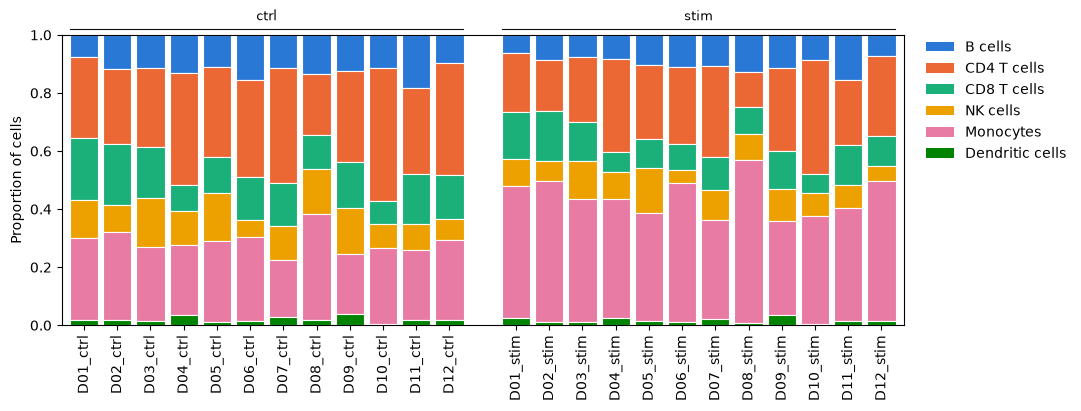
Test every cell type
Each donor gives a sample in each condition, so the design pairs them, as for the genes (Genes that change in each cell type); propeller fits fixed effects, and the donor enters the formula.
design = Design(
    cube.samples,
    "~ donor + condition",
    levels={"condition": ["ctrl", "stim"]},
    contrasts={"stim_vs_ctrl": "conditionstim"},
)
result = propeller(cube, design)
table = result.table("stim_vs_ctrl")
for group, ratio, adjusted in zip(
    table["group_id"], table["proportion_ratio"], table["adjusted_p_value"]
):
    print(
        f"{group:<16} stimulated / control {ratio:.2f}, adjusted p-value {adjusted:.2g}"
    )
plot_proportions(result, by="condition")
plt.show()
B cells stimulated / control 0.81, adjusted p-value 6.4e-05
CD4 T cells stimulated / control 0.78, adjusted p-value 1.7e-07
CD8 T cells stimulated / control 0.77, adjusted p-value 3.6e-07
NK cells stimulated / control 0.78, adjusted p-value 1.2e-05
Monocytes stimulated / control 1.60, adjusted p-value 4.6e-12
Dendritic cells stimulated / control 0.81, adjusted p-value 0.0052
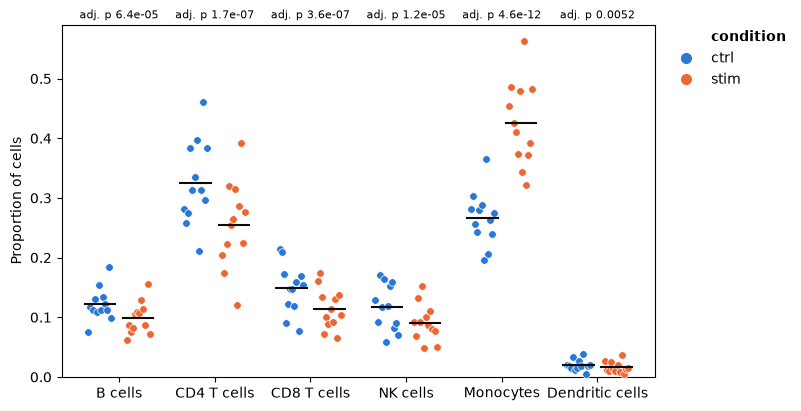
Every cell type tests significant, although the simulation changed only the monocytes: proportions add up to one, so when the monocytes gain, the shares of all the others fall. The ratios show what happened: the five other cell types fall by about the same factor, 0.77 to 0.81, which is what a rise of the monocytes alone does to them.
Test within a lineage
The denominator decides the question. Among the lymphocytes alone, the B, T and NK
cells, a rise of the monocytes does not move the shares, and the test asks whether the
stimulation changes the lymphocytes’ make-up. Cube.select keeps those cell
types.
lymphocytes = cube.select(groups=["B cells", "CD4 T cells", "CD8 T cells", "NK cells"])
within = propeller(lymphocytes, design)
plot_proportions(within, by="condition")
plt.show()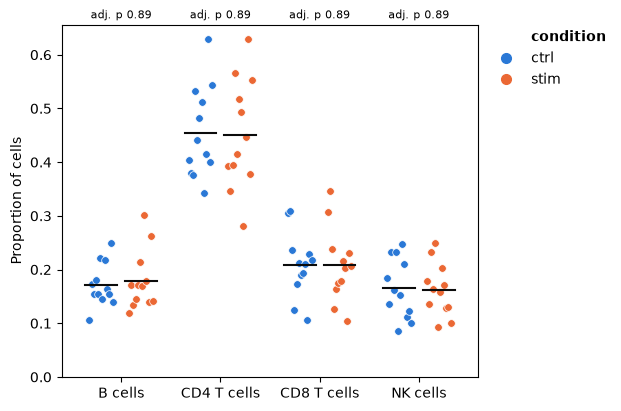
Within the lymphocytes nothing changes, as simulated: the rise of the monocytes lowered the lymphocytes’ share of all cells, not their make-up.
The design and the transform
Without the pairing, the differences between donors’ compositions count as noise. The arcsine square root is the alternative transform to the logit.
unpaired = Design(
    cube.samples,
    "~ condition",
    levels={"condition": ["ctrl", "stim"]},
    contrasts={"stim_vs_ctrl": "conditionstim"},
)
tests = {
    "paired, logit": propeller(cube, design),
    "paired, asin": propeller(cube, design, transform="asin"),
    "unpaired, logit": propeller(cube, unpaired),
}
tables = {name: test.table("stim_vs_ctrl") for name, test in tests.items()}
print("adjusted p-values of the stimulation")
print(f"{'':<17}" + "".join(f"{name:>17}" for name in tables))
for row, group in enumerate(tables["paired, logit"]["group_id"]):
    values = "".join(
        f"{table['adjusted_p_value'][row]:>17.2g}" for table in tables.values()
    )
    print(f"{group:<17}{values}")
adjusted p-values of the stimulation
paired, logit paired, asin unpaired, logit
B cells 6.4e-05 3.8e-06 0.083
CD4 T cells 1.7e-07 6.1e-16 0.05
CD8 T cells 3.6e-07 5.5e-09 0.079
NK cells 1.2e-05 3.5e-07 0.086
Monocytes 4.6e-12 3e-32 5.1e-06
Dendritic cells 0.0052 0.046 0.22
Pairing the samples matters more than the transform. Without it, the monocytes still stand out, but the falls of the other cell types are no longer clear, with adjusted p-values from 0.05 to 0.22. The arcsine square root gives smaller p-values than the logit here, and the same calls.
Choices
The design. Pair the samples of a donor when each donor gives one in every condition; propeller refuses random effects, so the donor is a fixed effect.
The denominator. Proportions are shares of the cell types tested: a change in one cell type moves the shares of all the others. Test the cell types of one lineage with
Cube.selectwhen the question is about that lineage, and read the proportion ratios of the result, not only its p-values.The transform. The logit, speckle’s default, or
transform="asin"; they agree on clear changes.Several conditions.
f_test="condition"tests every level of the condition at once, andplot_proportionsthen shows the F-test’s adjusted p-values.Not yet available. Precision-weighted mixed models and count models of composition (Composition tests).
- Phipson, B., Sim, C. B., Porrello, E. R., Hewitt, A. W., Powell, J., & Oshlack, A. (2022). propeller: testing for differences in cell type proportions in single cell data. Bioinformatics, 38(20), 4720–4726. 10.1093/bioinformatics/btac582