Which pathways respond to a treatment? A gene-set test asks it of a set of genes as a
whole, for one contrast, in one of two ways: are the set’s genes differentially
expressed at all (a self-contained test), or more than the other genes (a competitive
test) Goeman & Bühlmann, 2007. Gene-set tests explains each
test. This page asks both of the CD14+ monocytes of the Kang data Kang et al., 2018, first
for one set chosen in advance, the Hallmark interferon-alpha response of MSigDB
Liberzon et al., 2015, then for a collection of sets (the kang2018 and
hallmark_interferon_alpha datasets of the Datasets
page).
camera, fry and roast work on the linear model of one cell type, so they take its
voom result: the steps that limma_voom takes inside, here by hand.
import json

import matplotlib.pyplot as plt
import numpy as np

import cytepool
from cytepool.design import Design
from cytepool.differential_expression import limma_voom
from cytepool.gene_sets import GeneSets
from cytepool.gsea import gsea
from cytepool.io import read_cube
from cytepool.networks import collectri
from cytepool.normalization import filter_by_expression, tmm_factors
from cytepool.over_representation import over_representation
from cytepool.plotting import (
    plot_barcode,
    plot_enrichment,
    plot_gene_sets,
    plot_gsea_table,
    plot_over_representation,
)
from cytepool.stats.gene_set_tests import camera, fry
from cytepool.stats.rotation_gene_set_tests import roast
from cytepool.stats.voom import voom

kang = read_cube("kang2018.cube.zarr")
monocytes = "CD14+ Monocytes"
design = Design(
    kang.samples,
    "~ donor + condition",
    levels={"condition": ["ctrl", "stim"]},
    contrasts={"stim_vs_ctrl": "conditionstim"},
)
result = limma_voom(kang, design, groups=monocytes)
counts = kang.layer("counts", monocytes)
keep = filter_by_expression(counts, design=design)
weighted = voom(counts[:, keep], design, norm_factors=tmm_factors(counts[:, keep]))
symbols = kang.features["symbol"][keep]

with open("hallmark_interferon_alpha_response.json") as file:
    hallmark = json.load(file)
# Two genes of the set have earlier symbols in the annotation of these data.
interferon = [hallmark["earlier_symbols"].get(gene, gene) for gene in hallmark["genes"]]
print(f"CytePool {cytepool.__version__}")
print(
    f"{np.isin(interferon, symbols).sum()} of the set's {len(interferon)} genes are among the {keep.sum():,} genes tested"
)
CytePool 0.1.dev54+g3f0cbb52e
92 of the set's 97 genes are among the 5,125 genes tested
One set chosen in advance
limma’s barcode plot shows where the set’s genes fall among all genes ranked by their moderated t-statistic, with a worm above that rises where the set is enriched.
table = result.table(monocytes, "stim_vs_ctrl")
plot_barcode(table, np.isin(table["symbol"], interferon))
plt.show()

sets = {"interferon-alpha response": interferon}
rotations = roast(weighted, design, "stim_vs_ctrl", interferon, gene_ids=symbols, rng=1)
tests = {
    "fry, self-contained": fry(
        weighted, design, "stim_vs_ctrl", sets, gene_ids=symbols
    ),
    "roast, self-contained": rotations.filter(rotations["alternative"] == "up"),
    "camera, competitive": camera(
        weighted, design, "stim_vs_ctrl", sets, gene_ids=symbols
    ),
}
for name, test in tests.items():
    print(f"{name:<23} p-value {test['p_value'][0]:.2g}")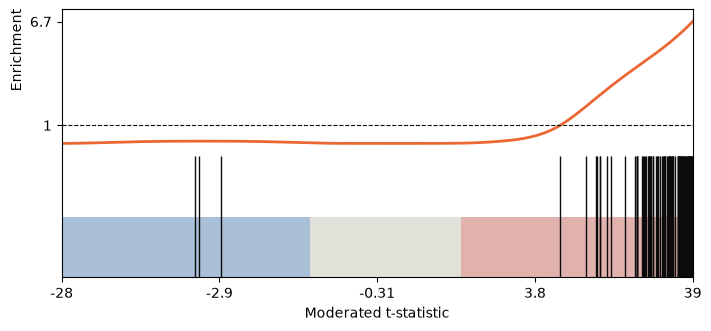
fry, self-contained     p-value 5.8e-08
roast, self-contained   p-value 0.00025
camera, competitive     p-value 2.5e-35
Nearly all the set’s genes go up with the stimulation. The three tests agree, but answer different questions. fry and roast ask whether the set’s genes respond at all: fry’s p-value comes from a t distribution on the design’s seven residual degrees of freedom, and roast’s, 0.00025, is the smallest its 1,999 rotations give for one direction. camera asks whether they respond more than the other genes, a stricter question when thousands of genes respond, and compares them with every other gene.
A collection of sets
Any collection of sets works, such as a GMT file of MSigDB, Reactome or the Gene
Ontology read by read_gmt, under its provider’s terms; CytePool bundles none.
Here each transcription factor’s targets in CollecTRI Müller-Dott et al., 2023 form a set.
collectri downloads it on first use and returns, by default, the interactions
whose sources allow commercial use (Datasets
gives the terms). GeneSets.restrict_to keeps each set’s tested genes and
GeneSets.filter_by_size the sets of 15 to 500 of them. camera then ranks them.
network = collectri()
regulons = GeneSets(
    {regulator: list(targets) for regulator, targets in network.items()},
    source=network.name,
    version=network.version,
    licence=network.licence,
)
regulons = regulons.restrict_to(symbols).filter_by_size(15, 500)
print(regulons)
ranked = camera(weighted, design, "stim_vs_ctrl", regulons, gene_ids=symbols)
plot_gene_sets(ranked)
plt.show()
GeneSets: 199 sets of 15 to 435 genes, 1,893 genes in all
source: CollecTRI; version: 2.0 (Zenodo record 8192729); licence: CC BY 4.0 (Zenodo record 8192729); level 'commercial': the interactions of resources that OmniPath lists for commercial use, without those that GEREDB (listed for academic use) alone supports; each resource keeps its own terms
sets: MYC (383), SPI1 (133), SMAD3 (41) and 196 more
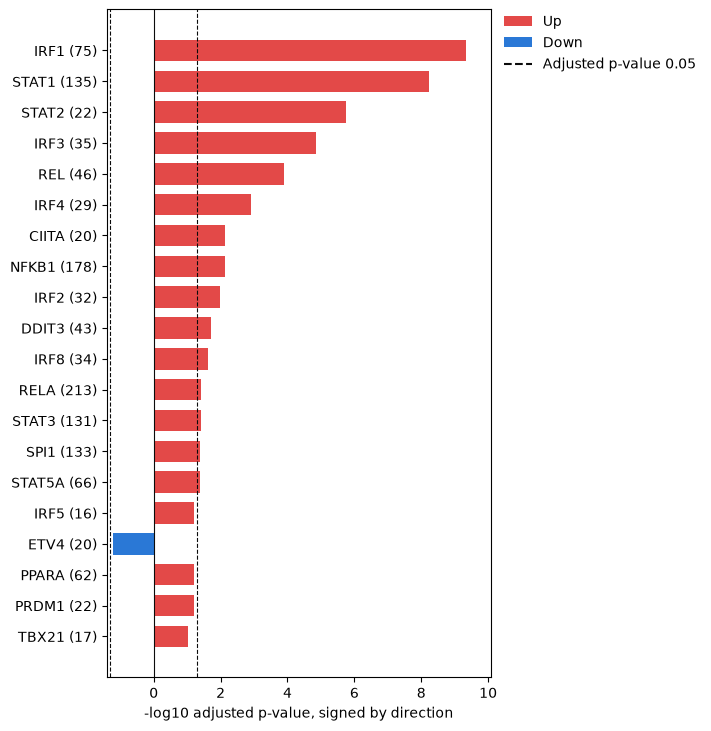
The targets of interferon regulatory factors and of STAT1 and STAT2 rise more than
the other genes. camera’s default inter-gene correlation, 0.01, ranks sets of
co-regulated genes higher; inter_gene_correlation=None estimates it for each set,
which controls the error rate of each set more strictly.
Over-representation among the changed genes
over_representation asks whether the genes called significant hold more of a
set’s genes than chance would give, separately for the genes up, those down and both,
as limma’s kegga does Young et al., 2010. Its universe is the genes tested.
enriched = over_representation(
    result, regulons, group=monocytes, contrast="stim_vs_ctrl", id_column="symbol"
)
plot_over_representation(enriched)
plt.show()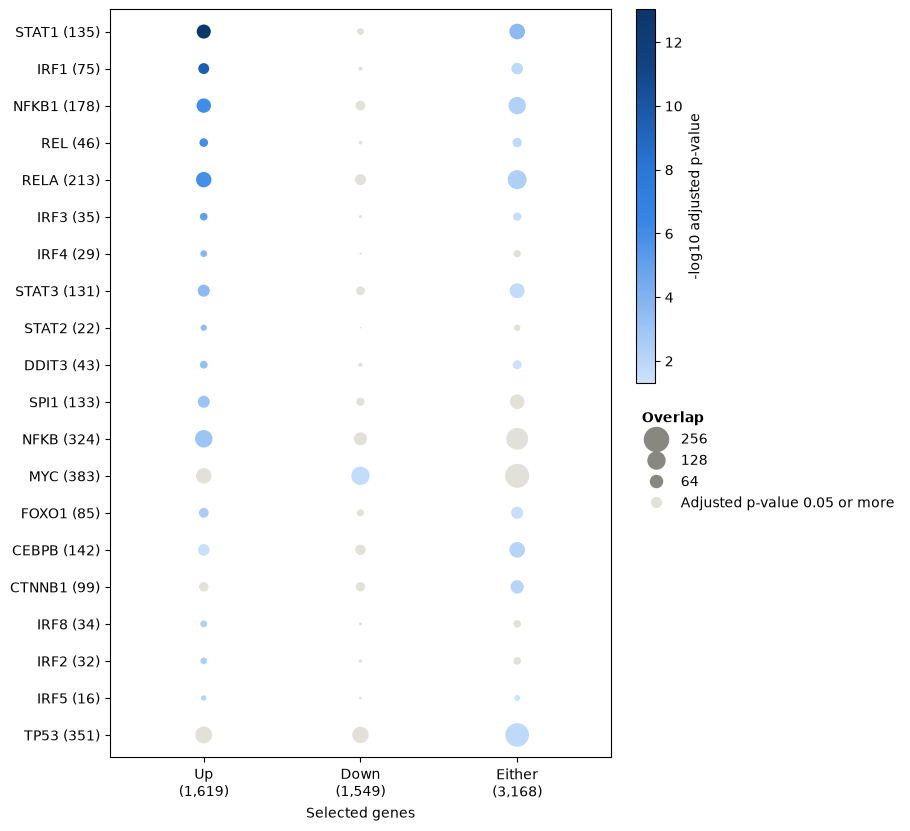
The genes up hold the targets of the same regulators, and the genes down hold MYC’s. The lists, and so the result, depend on the cutoff of 0.05 that made them.
Gene set enrichment analysis
gsea ranks every tested gene by its moderated t-statistic and asks whether a
set’s genes gather at the top or the bottom of the ranking, as fgsea does
Subramanian et al., 2005Korotkevich et al., 2021. The enrichment plot follows the running score of
one set down the ranking, and fgsea’s table shows the top sets with their genes.
enrichment = gsea(
    result,
    regulons,
    group=monocytes,
    contrast="stim_vs_ctrl",
    id_column="symbol",
    rng=1,
)
plot_enrichment(
    result,
    regulons["STAT1"],
    group=monocytes,
    contrast="stim_vs_ctrl",
    id_column="symbol",
)
plt.show()
plot_gsea_table(
    result,
    regulons,
    enrichment,
    group=monocytes,
    contrast="stim_vs_ctrl",
    id_column="symbol",
)
plt.show()
/tmp/ipykernel_728278/842382742.py:1: RuntimeWarning: 1 gene set(s) have fewer than 10 random scores of the sign of their enrichment score among 1000 permutations, as statistics mostly of one sign give; their normalized scores and p-values are NaN. More permutations (n_permutations=10000) may give them some
enrichment = gsea(
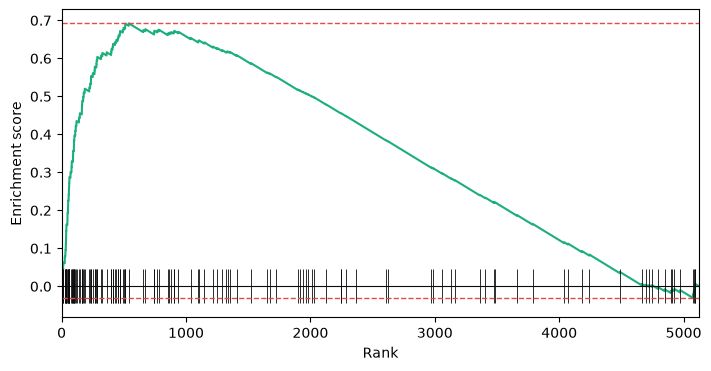
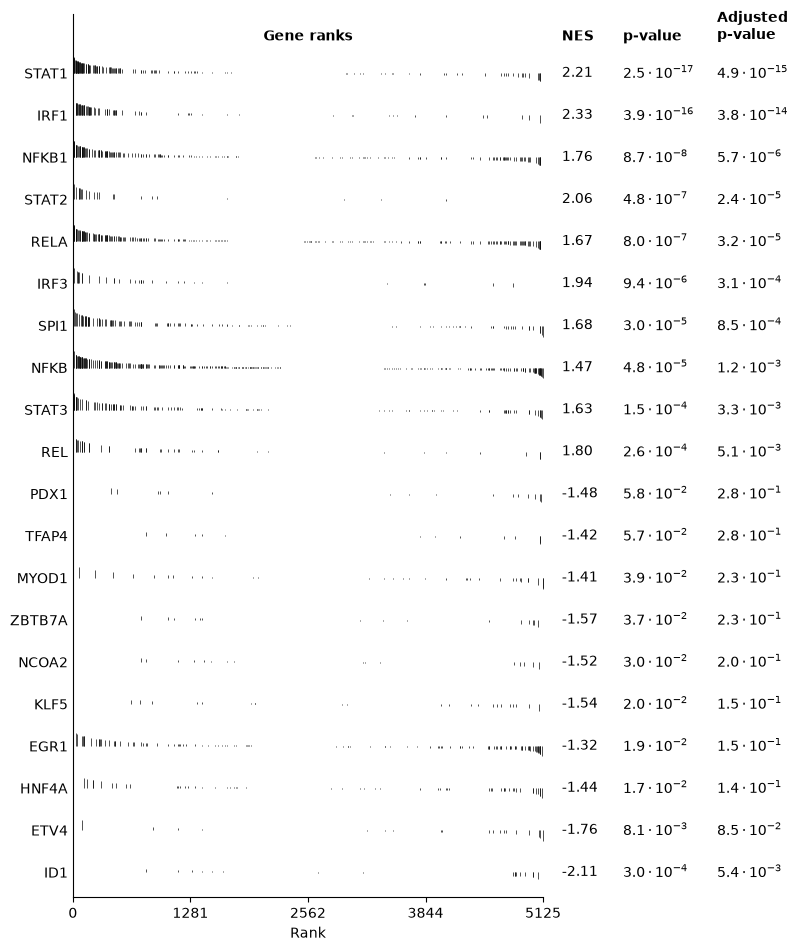
GSEA ranks the same regulators first, now from the whole ranking rather than a cutoff, and finds ID1’s targets at the bottom. It warns that one set, the 383 targets of MYC, has too few random scores of its sign to be tested; its p-value is missing, as fgsea leaves it.
Choices
One set or many. For a set chosen in advance, a self-contained test,
fryorroast, answers whether it responds at all; to rank a collection, use a competitive test,cameraorromer.mroastruns roast on many sets with the same rotations.camera, over-representation or GSEA. camera uses every gene’s statistic and allows for the correlation between the genes of a set; over-representation needs only a list of genes, and depends on the cutoff that made it; GSEA needs only a ranking, from any method. Over-representation and GSEA take genes as independent, which makes their p-values too small for sets of genes that respond together (Gene-set tests).
Rotations and permutations. roast’s smallest p-value is about one over its number of rotations (
n_rotations, 1,999 by default), and GSEA’s random sets are drawn fromrng: pass a seed to get the same p-values every time.The collection. Restrict the sets to the genes tested and to a range of sizes before testing, and name genes as the data do: symbols here, Ensembl ids in
feature_id.Scores per sample. To compare samples rather than test one contrast, score each set or regulator in every sample: Pathway and regulator activity.
- Goeman, J. J., & Bühlmann, P. (2007). Analyzing gene expression data in terms of gene sets: methodological issues. Bioinformatics, 23(8), 980–987. 10.1093/bioinformatics/btm051
- Kang, H. M., Subramaniam, M., Targ, S., Nguyen, M., Maliskova, L., McCarthy, E., Wan, E., Wong, S., Byrnes, L., Lanata, C. M., Gate, R. E., Mostafavi, S., Marson, A., Zaitlen, N., Criswell, L. A., & Ye, C. J. (2018). Multiplexed droplet single-cell RNA-sequencing using natural genetic variation. Nature Biotechnology, 36(1), 89–94. 10.1038/nbt.4042
- Liberzon, A., Birger, C., Thorvaldsdóttir, H., Ghandi, M., Mesirov, J. P., & Tamayo, P. (2015). The Molecular Signatures Database hallmark gene set collection. Cell Systems, 1(6), 417–425. 10.1016/j.cels.2015.12.004
- Müller-Dott, S., Tsirvouli, E., Vazquez, M., Ramirez Flores, R. O., Badia-i Mompel, P., Fallegger, R., Türei, D., Lægreid, A., & Saez-Rodriguez, J. (2023). Expanding the coverage of regulons from high-confidence prior knowledge for accurate estimation of transcription factor activities. Nucleic Acids Research, 51(20), 10934–10949. 10.1093/nar/gkad841
- Young, M. D., Wakefield, M. J., Smyth, G. K., & Oshlack, A. (2010). Gene ontology analysis for RNA-seq: accounting for selection bias. Genome Biology, 11(2), R14. 10.1186/gb-2010-11-2-r14
- Subramanian, A., Tamayo, P., Mootha, V. K., Mukherjee, S., Ebert, B. L., Gillette, M. A., Paulovich, A., Pomeroy, S. L., Golub, T. R., Lander, E. S., & Mesirov, J. P. (2005). Gene set enrichment analysis: A knowledge-based approach for interpreting genome-wide expression profiles. Proceedings of the National Academy of Sciences, 102(43), 15545–15550. 10.1073/pnas.0506580102
- Korotkevich, G., Sukhov, V., Budin, N., Shpak, B., Artyomov, M. N., & Sergushichev, A. (2021). Fast gene set enrichment analysis. bioRxiv 060012, version 3. 10.1101/060012