Combine cells from several CyteBase datasets, run a joint RNA analysis, and reopen its results later. Counts stay in the source datasets; your new results are saved locally.
This example combines human blood and PBMC data from Wilk et al. (2020), Lee et al. (2020), Arunachalam et al., and Schulte-Schrepping et al. The latter two are study-specific subsets republished by Jin et al. (2021).
The four sources contain 244,389 cells. We include all 233,870 primary COVID-19 or normal cells before QC, with no random subsampling, and compare matched analyses before and after Harmony correction by study. This is a joint reanalysis example, not a test of disease effects.
Use a Python 3.13+ notebook environment with this checkout installed:
uv pip install -e ".[cytebase,extra]"The public catalog requires network access but no token. The saved results on
this page were built with the CyteBase October 2026 release (2610), published
in the public Nygen/cytebase-2610 bucket.
1. Choose datasets
The IDs below select the four studies. For your own analysis, choose compatible datasets from the same organism with matching gene IDs.
# Import the catalog, composite creator, and notebook display tools.
from pathlib import Path

import numpy as np
import pandas as pd
from IPython.display import display

import cytearc
from cytearc.composite import create_composite
from cytearc.cytebase import Catalog

# Choose resources for source reads, composite creation, and the pipeline.
memory_budget = "6G"
workers = 4

# Keep routine pipeline progress out of the notebook output.
cytearc.configure_output(level="WARNING", progress=False)

# Open the October 2026 release anonymously; counts remain remote.
catalog = Catalog(version="2610", token=False)
Started: 2026-10-12T17:08:18.093213Z | Wall time: 4.427 s
The names on the left become values in the composite’s dataset column.
Replace the IDs or add entries to use other studies.
# Pin the four CyteBase datasets under names used in the joint analysis.
dataset_ids = {
    "blood_wilk": "wilk_2020_single_cell_atlas_peripheral_sars_cov_2_infection_456e8b9b",
    "blood_lee": "lee_2020_immunophenotyping_covid_19_development_severe_covid_19_de2c780c",
    "blood_arunachalam": "jin_2021_individual_single_cell_rna_seq_pbmc_data_arunachalam_et_al_59b69042",
    "blood_schulte_schrepping": "jin_2021_individual_single_cell_rna_seq_data_schulte_schrepping_et_al_5e717147",
}
Started: 2026-10-12T17:08:22.524839Z | Wall time: 0.010 s
Open the prepared source datasets through the catalog. These datastores are read-only; analysis results will be written to the new composite.
# Open each source once and retain it for composite creation.
sources = {
    name: catalog.open_datastore(
        dataset_id,
        mem_budget=memory_budget,
        nthreads=workers,
    )
    for name, dataset_id in dataset_ids.items()
}
Started: 2026-10-12T17:08:22.538500Z | Wall time: 84.438 s
2. Select cells
Include every primary cell whose disease label is COVID-19 or normal. This
excludes Lee’s influenza samples and does not impose a per-study cell cap.
rows contains positions in each original source dataset. Omitting rows from
create_composite includes all stored cells, including inactive ones.
# Select primary COVID-19 and normal cells using the original source metadata.
rows = {}
for name, source in sources.items():
    primary = source.cells.fetch_all("is_primary_data")
    disease = source.cells.fetch_all("disease")
    selected = np.flatnonzero(primary & np.isin(disease, ["COVID-19", "normal"]))

    # Require every chosen study to contribute cells.
    if selected.size == 0:
        raise ValueError(f"No primary COVID-19 or normal cells selected for {name!r}")
    rows[name] = selected

# Show the complete selected size for each study before QC.
display(
    pd.DataFrame(
        {
            "source_cells": {name: source.cells.N for name, source in sources.items()},
            "selected_cells": {name: len(selected) for name, selected in rows.items()},
        }
    )
)| source_cells | selected_cells | |
|---|---|---|
| blood_wilk | 44721 | 44721 |
| blood_lee | 59572 | 49053 |
| blood_arunachalam | 49139 | 49139 |
| blood_schulte_schrepping | 90957 | 90957 |
Started: 2026-10-12T17:09:46.982241Z | Wall time: 9.473 s
3. Create the composite
Use features="intersection" to keep the 19,405 gene IDs shared by all four
sources. features="union" would retain every gene, filling absent source genes
with zeros; absence from a source is not evidence that a gene was unexpressed.
Choose a new local path. Creation scans the selected counts to prepare the composite, but leaves the counts in their source datasets. If the path already exists, reopen it using the example at the end of this notebook.
# Choose a new local destination outside every source store.
joint_path = Path("joint_cytebase.zarr")

# Create an ordinary writable DataStore with counts backed by the selected sources.
joint = create_composite(
    sources,
    at=joint_path,
    assay="RNA",
    features="intersection",
    rows=rows,
    mem_budget=memory_budget,
    nthreads=workers,
)

# Confirm the combined cells and shared genes.
print(f"{joint.cells.N:,} cells and {joint.RNA.feats.N:,} shared genes")
233,870 cells and 19,405 shared genes
Started: 2026-10-12T17:09:56.458952Z | Wall time: 201.266 s
The dataset column identifies each cell’s source. Original metadata is preserved
with an orig_ prefix. Check the cells and donors in each study and condition
before correcting by study. Donor IDs are interpreted within their source study;
matching strings across studies do not establish a shared donor.
# Freeze the same design columns, with the Harmony column first, in both runs.
snapshot_columns = ["dataset", "orig_disease", "orig_donor_id"]
design = joint.cells.to_pandas_dataframe(snapshot_columns, key=None)

# Check condition coverage and donor representation within each study.
display(
    design.groupby(["dataset", "orig_disease"], observed=True).agg(
        cells=("orig_donor_id", "size"),
        donors=("orig_donor_id", "nunique"),
    )
)

# Check whether any within-study donor appears in both conditions.
donor_conditions = design.groupby(["dataset", "orig_donor_id"], observed=True)[
    "orig_disease"
].nunique()
print(
    f"Within-study donors represented in both conditions: {(donor_conditions > 1).sum()}"
)| cells | donors | ||
|---|---|---|---|
| dataset | orig_disease | ||
| blood_arunachalam | COVID-19 | 23185 | 7 |
| normal | 25954 | 5 | |
| blood_lee | COVID-19 | 31463 | 8 |
| normal | 17590 | 4 | |
| blood_schulte_schrepping | COVID-19 | 45170 | 18 |
| normal | 45787 | 21 | |
| blood_wilk | COVID-19 | 28094 | 7 |
| normal | 16627 | 6 |
Within-study donors represented in both conditions: 0
Started: 2026-10-12T17:13:17.727496Z | Wall time: 0.515 s
4. Run the uncorrected RNA pipeline
Run the usual pipeline to calculate PCA, UMAP, clusters, and markers. This example applies MAD QC filtering separately within each dataset and uses a human gene blacklist for feature selection. The same settings and frozen design columns are used for the Harmony run. Author cell-type labels are not used to choose settings.
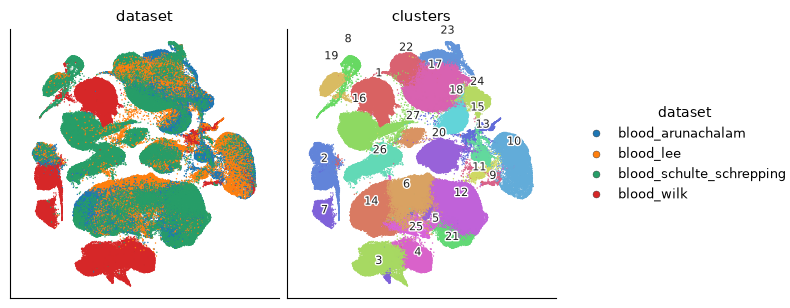
The retention table shows how QC affects each study and condition. Inspect removals before reusing this filtering policy for another analysis. The UMAPs show the retained cells colored by dataset and cluster.
# Define a human gene-symbol blacklist, including current histone names.
hvg_blacklist = "|".join(
    [
        r"^MT-",
        r"^RP[SL]\d+[AXY]?\d*$|^RPLP[0-2]$|^RPSA$|^MRP[SL]\d+[A-C]?$",
        r"^HLA-",
        r"^HIST[1-4]H|^H1-[1-6]$|^H1F[1-6]$|^H2AC\d+$|^H2BC\d+$"
        r"|^H3C\d+$|^H4C\d+$|^H2AW$|^H3-4$|^H4-16$",
        r"^XIST$|^DDX3Y$|^USP9Y$|^EIF1AY$|^KDM5D$|^SRY$|^ZFY$"
        r"|^UTY$|^TMSB4Y$|^NLGN4Y$",
    ]
)

# Keep the reviewed filtering and feature settings shared between comparison runs.
filtering = {"method": "mad", "sample_column": "dataset", "n_mads": 5}
pipeline_params = {
    "species": "homo_sapiens",
    "hvg": {"blacklist": hvg_blacklist},
}

# Run joint analysis without batch correction as the comparison baseline.
baseline = joint.pipeline.run(
    assay="RNA",
    label="joint_baseline",
    filtering=filtering,
    snapshot_columns=snapshot_columns,
    params=pipeline_params,
)
WARNING: 2 of 43 s_genes were not found in the assay feature names
WARNING: 1 of 54 g2m_genes were not found in the assay feature names
Started: 2026-10-12T17:13:18.245946Z | Wall time: 886.771 s
# Audit QC retention against all selected cells in each study and condition.
retention = design[["dataset", "orig_disease"]].copy()
retention["retained"] = baseline.cells.fetch_all("I")
display(
    retention.groupby(["dataset", "orig_disease"], observed=True)["retained"]
    .agg(included="size", retained="sum", retained_fraction="mean")
    .round(3)
)

# Show the uncorrected embedding by source study and by cluster.
joint.plots.embedding(run=baseline, color_by=["dataset", "clusters"], n_columns=2)| included | retained | retained_fraction | ||
|---|---|---|---|---|
| dataset | orig_disease | |||
| blood_arunachalam | COVID-19 | 23185 | 23184 | 1.000 |
| normal | 25954 | 25953 | 1.000 | |
| blood_lee | COVID-19 | 31463 | 30592 | 0.972 |
| normal | 17590 | 17526 | 0.996 | |
| blood_schulte_schrepping | COVID-19 | 45170 | 44003 | 0.974 |
| normal | 45787 | 45250 | 0.988 | |
| blood_wilk | COVID-19 | 28094 | 27687 | 0.986 |
| normal | 16627 | 16509 | 0.993 |
Started: 2026-10-12T17:28:05.021150Z | Wall time: 8.927 s
5. Compare with Harmony correction
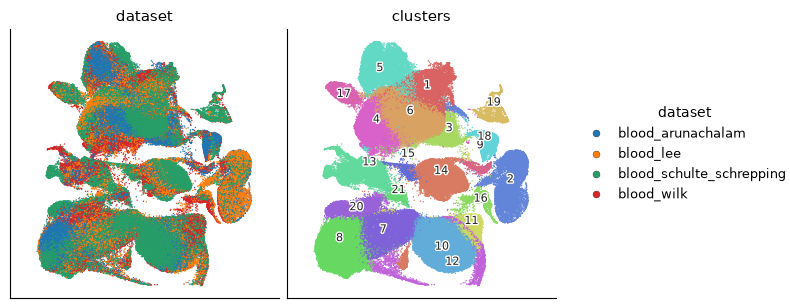
Save a second run with harmony_batch_columns=["dataset"]. Both runs use the same
cells and PCA; Harmony changes the coordinates used to construct the graph,
embedding, and clusters. Source counts remain unchanged.
Compare the plots below with the uncorrected plots above. More mixing alone does not establish a better biological result: studies differ in cohort, collection, and technology, and their cell populations need not have the same composition. This notebook does not infer disease effects from the corrected embedding.
# Save the corrected analysis as a separate run with matched upstream settings.
run = joint.pipeline.run(
    assay="RNA",
    label="joint_harmony",
    filtering=filtering,
    harmony_batch_columns=["dataset"],
    snapshot_columns=snapshot_columns,
    params=pipeline_params,
)

# Confirm that both comparisons start from the same frozen cells and PCA.
assert baseline["analysis_cell_selection"] == run["analysis_cell_selection"]
assert baseline["pca"] == run["pca"]

# Show the corrected embedding using the same coloring as the baseline.
joint.plots.embedding(run=run, color_by=["dataset", "clusters"], n_columns=2)
WARNING: 2 of 43 s_genes were not found in the assay feature names
WARNING: 1 of 54 g2m_genes were not found in the assay feature names
Started: 2026-10-12T17:28:13.951932Z | Wall time: 936.329 s
6. Inspect results and reopen later
Load the saved markers and inspect each study’s contribution to the corrected clusters. These marker lists are a starting point for annotation, not cell-type assignments.
# Summarize the top five saved marker genes per corrected cluster.
markers = joint.markers.load(marker=run["markers"])
display(
    markers.groupby("group_id", sort=False)
    .head(5)
    .groupby("group_id", sort=False)["feature_name"]
    .agg(", ".join)
    .rename("top_markers")
)

# Read study membership and clustering from the run's frozen cell view.
assignments = run.cells.to_pandas_dataframe(["dataset", "clusters"])
display(pd.crosstab(assignments["dataset"], assignments["clusters"]))

# Keep the corrected run label for the reopen call below.
run_label = run.label
group_id
1 SIGLEC1, OTOF, TCN2, CD163, APOBEC3A
2 TMEM40, GP9, CMTM5, ESAM, CLDN5
3 ENHO, CD1E, PKIB, CLEC10A, CD1C
5 LYPD2, VMO1, CDKN1C, NEURL1, CKB
6 CYP27A1, CXCL2, HOMER3, CYP1B1, TMEM176A
7 A2M-AS1, CD8A, LINC01871, TRGC2, CD8B
8 NCR1, NCAM1, SH2D1B, MYOM2, DTHD1
9 CD34, NPR3, CRHBP, CYTL1, PRSS57
10 MAL, NELL2, RETREG1, TRABD2A, TSHZ2
11 TSHZ2, ANK3, RNF157, CD28, CHRM3-AS2
12 SPC25, CDC45, MELK, MND1, PKMYT1
13 TNFRSF17, IGHG2, POU2AF1, ELL2, IGHA2
14 LINC02397, PAX5, FCRL1, PLEKHG1, EBF1
15 VPREB3, LINC00926, MS4A1, FCRLA, IGHD
16 ALAS2, AHSP, SLC4A1, CA1, HBM
17 ALPL, CMTM2, CXCR1, MME, KCNJ15
18 CLEC4C, LRRC26, LILRA4, SHD, PROC
19 CEACAM8, MMP8, LTF, BPI, ABCA13
20 KLRF1, TRDC, KLRD1, KLRB1
Name: top_markers, dtype: str| clusters | 1 | 2 | 3 | 4 | 5 | 6 | 7 | 8 | 9 | 10 | ... | 12 | 13 | 14 | 15 | 16 | 17 | 18 | 19 | 20 | 21 |
|---|---|---|---|---|---|---|---|---|---|---|---|---|---|---|---|---|---|---|---|---|---|
| dataset | |||||||||||||||||||||
| blood_arunachalam | 2783 | 4342 | 2511 | 907 | 3302 | 4657 | 5248 | 6715 | 549 | 9200 | ... | 366 | 1439 | 3198 | 19 | 308 | 84 | 2142 | 68 | 272 | 97 |
| blood_lee | 3135 | 3941 | 574 | 1705 | 2350 | 7481 | 6530 | 7736 | 34 | 6169 | ... | 478 | 498 | 6023 | 53 | 423 | 227 | 110 | 68 | 327 | 69 |
| blood_schulte_schrepping | 3579 | 886 | 475 | 12225 | 3509 | 11012 | 7892 | 6123 | 70 | 16951 | ... | 1107 | 5210 | 4583 | 1954 | 284 | 1881 | 482 | 1265 | 5735 | 2063 |
| blood_wilk | 3801 | 666 | 504 | 1928 | 1455 | 4789 | 5609 | 7108 | 301 | 7251 | ... | 660 | 3185 | 3582 | 67 | 871 | 285 | 237 | 198 | 590 | 197 |
4 rows × 21 columns
Started: 2026-10-12T17:43:50.301734Z | Wall time: 0.828 s
Reopen the local composite and load a saved pipeline run by its label. The original CyteBase sources must remain available and unchanged because the composite still reads their counts. Both analyses are saved in the local composite.
# Supply anonymous access for these public CyteBase sources on each reopen.
source_storage_options = {name: {"token": False} for name in dataset_ids}

# Reopen the composite through the ordinary DataStore constructor.
reopened = cytearc.DataStore(
    str(joint_path),
    min_features_per_cell=-1,
    mem_budget=memory_budget,
    nthreads=workers,
    source_storage_options=source_storage_options,
)

# Load the saved corrected run and confirm that its clustering is preserved.
reopened_run = reopened.pipeline.open(label=run_label)
assert reopened_run["clusters"] == run["clusters"]
print(f"Reopened {reopened_run.label}: {reopened_run.status}")
Reopened joint_harmony: completed
Started: 2026-10-12T17:43:51.132275Z | Wall time: 33.736 s
Continue with quality control, Harmony comparisons, or CyteBase discovery.
- Wilk, A. J., Rustagi, A., Zhao, N. Q., Roque, J., Martínez-Colón, G. J., McKechnie, J. L., Ivison, G. T., Ranganath, T., Vergara, R., Hollis, T., Simpson, L. J., Grant, P., Subramanian, A., Rogers, A. J., & Blish, C. A. (2020). A single-cell atlas of the peripheral immune response in patients with severe COVID-19. Nature Medicine, 26(7), 1070–1076. 10.1038/s41591-020-0944-y
- Lee, J. S., Park, S., Jeong, H. W., Ahn, J. Y., Choi, S. J., Lee, H., Choi, B., Nam, S. K., Sa, M., Kwon, J.-S., Jeong, S. J., Lee, H. K., Park, S. H., Park, S.-H., Choi, J. Y., Kim, S.-H., Jung, I., & Shin, E.-C. (2020). Immunophenotyping of COVID-19 and influenza highlights the role of type I interferons in development of severe COVID-19. Science Immunology, 5(49). 10.1126/sciimmunol.abd1554
- Jin, K., Bardes, E. E., Mitelpunkt, A., Wang, J. Y., Bhatnagar, S., Sengupta, S., Krummel, D. P., Rothenberg, M. E., & Aronow, B. J. (2021). An interactive single cell web portal identifies gene and cell networks in COVID-19 host responses. iScience, 24(10), 103115. 10.1016/j.isci.2021.103115