To analyse cells from several datasets together, first place their compatible assays in one
datastore. DataStoreMerge aligns features, carries metadata, and records which source each
cell came from. The expression values are unchanged by the merge. Batch correction, when
appropriate, is a separate step; this page builds and inspects the uncorrected dataset.
Load compatible source stores
The control and interferon beta stimulated Kang PBMC stores use the same RNA feature space.
These prepared stores contain cells with author-provided cell-type labels.
Their I columns mark the cells that passed quality control.
# Import tools for creating and inspecting a merged count store.
from pathlib import Path
from tempfile import TemporaryDirectory

import pandas as pd

import cytearc

# Keep routine progress messages out of the teaching output.
cytearc.configure_output(level="ERROR", progress=False)

# Connect to the repository of prepared documentation datasets.
repository = cytearc.cytebase.connect("cytearc_docs")

# Download the control PBMC store.
ctrl_path = repository.download_dataset(
    name="kang_15K_pbmc_rnaseq", destination="cytearc_datasets", zarr=True
)
Started: 2026-10-11T18:54:46.173170Z | Wall time: 5.383 s
Download the stimulated sample from the same repository.
# Download the interferon-stimulated PBMC store.
stim_path = repository.download_dataset(
    name="kang_14K_ifnb-pbmc_rnaseq", destination="cytearc_datasets", zarr=True
)
Started: 2026-10-11T18:54:51.559564Z | Wall time: 3.814 s
Open both source stores before checking their axes.
# Open the control sample.
ds_ctrl = cytearc.DataStore(f"{ctrl_path}/data.zarr", nthreads=4)

# Open the stimulated sample.
ds_stim = cytearc.DataStore(f"{stim_path}/data.zarr", nthreads=4)
Started: 2026-10-11T18:54:55.376524Z | Wall time: 5.552 s
Confirm assay type, cell counts, and feature counts before merging. DataStoreMerge validates the
feature axes and requires every source to declare the same assay type, which the merged assay
keeps; matching gene symbols alone do not establish compatible genome builds or quantification
conventions.
# Compare assay types and cell and feature counts before merging.
pd.DataFrame(
    [
        {
            "source": label,
            "assay": type(store.RNA).__name__,
            "cells": store.cells.N,
            "active cells": int(store.cells.fetch_all("I").sum()),
            "features": store.RNA.feats.N,
        }
        for label, store in (("ctrl", ds_ctrl), ("stim", ds_stim))
    ]
)| source | assay | cells | active cells | features | |
|---|---|---|---|---|---|
| 0 | ctrl | RNAassay | 8487 | 8486 | 35635 |
| 1 | stim | RNAassay | 10111 | 10111 | 35635 |
Started: 2026-10-11T18:55:00.930984Z | Wall time: 0.024 s
Merge counts and metadata
names supplies the source labels, source_column names their metadata column, and prepend_text
keeps imported metadata names distinct from columns authored in the merged store.
reset_cell_filter=False copies each source’s I values into the merged store. Cells marked
False are still present in the counts and metadata, but remain outside the active selection.
A merge never replaces a store that a DataStore has opened, even with overwrite=True, so this
example writes into a new temporary folder each time it runs.
# Keep the merged example in a temporary folder.
merge_directory = TemporaryDirectory()

# Choose a new path for the merged counts.
merged_path = Path(merge_directory.name) / "kang_dataset_merging.zarr"

# Write the prepared counts and metadata to the new store.
cytearc.DataStoreMerge(
    datasets=[ds_ctrl, ds_stim],
    zarr_path=str(merged_path),
    names=["ctrl", "stim"],
    assays=["RNA"],
    prepend_text="orig",
    reset_cell_filter=False,
    source_column="sample_id",
).dump()

# Open the completed merge to inspect its cells and features.
merged = cytearc.DataStore(str(merged_path), nthreads=4)

# Check the merged cell and feature dimensions.
merged
DataStore has 18597 (18598) cells with 1 assays: RNA
Cell metadata:
'I', 'ids', 'names', 'RNA_I', 'RNA_nCounts',
'RNA_nFeatures', 'RNA_percentMito', 'RNA_percentRibo', 'orig_RNA_UMAP1', 'orig_RNA_UMAP2',
'orig_RNA_clusters', 'orig_RNA_leiden_cluster', 'orig_cluster_labels', 'sample_id'
RNA assay has 35635 features and following metadata:
'I', 'ids', 'names', 'dropOuts', 'nCells'Started: 2026-10-11T18:55:00.957803Z | Wall time: 15.629 s
sample_id records the source label.
Columns imported from the sources keep the orig_ prefix so their origin remains explicit.
RNA_I marks the cells that the merged RNA assay measured; every cell here comes from an RNA
source, so it is True for all of them. When a source lacks an assay, or measured only some of its
cells with it, the merged <assay>_I column keeps that per-cell membership. Operations that read
that assay’s values then refuse the cells it did not measure, whose counts are zero-filled, and
merged.select_measured_cells("<assay>", cell_selection=...) keeps the measured ones; here it
returns the selection unchanged, because RNA measured every cell.
The merged active population contains labelled cells from both sources.
# Read source labels and imported cell types for active cells.
merged_labels = merged.cells.to_pandas_dataframe(
    ["sample_id", "orig_cluster_labels"], key="I"
)

# Count active cells and distinct imported cell types from each source.
merged_labels.groupby("sample_id")["orig_cluster_labels"].agg(
    cells="count", cell_types="nunique"
)| cells | cell_types | |
|---|---|---|
| sample_id | ||
| ctrl | 8486 | 13 |
| stim | 10111 | 13 |
Started: 2026-10-11T18:55:16.589498Z | Wall time: 0.039 s
Inspect a prepared joint analysis
The merge is complete. To see what these datasets look like together, open the catalog’s prepared
merged store. It uses the same merge recipe and already contains PCA, clustering, and UMAP
computed without batch correction.
This is a separate store from merged, so the following plots do not run an analysis on the store
you just created. The saved example run is named docs_default.
# Download the separate, pre-analyzed joint example.
prepared_path = repository.download_dataset(
    name="kang_29K_ctrl-ifnb_pbmc_rnaseq", destination="cytearc_datasets", zarr=True
)

# Open the datastore for the following analysis.
ds = cytearc.DataStore(f"{prepared_path}/data.zarr", nthreads=4)

# Open the prepared baseline for the comparisons below.
baseline = ds.pipeline.open(label="docs_default")

# List the results available in the separate prepared analysis.
sorted(baseline)
['analysis_cell_selection',
'ann_index',
'cluster_selection',
'clusters',
'connectivity_map',
'embedding_initialization',
'feature_universe',
'highly_variable_features',
'input_cell_selection',
'leiden_1.0',
'neighbors',
'normalized',
'pca',
'umap']Started: 2026-10-11T18:55:16.631321Z | Wall time: 5.088 s
The saved run links each output name to its stored artifact. Its cell selection and metadata stay fixed even if the datastore’s live metadata changes later.
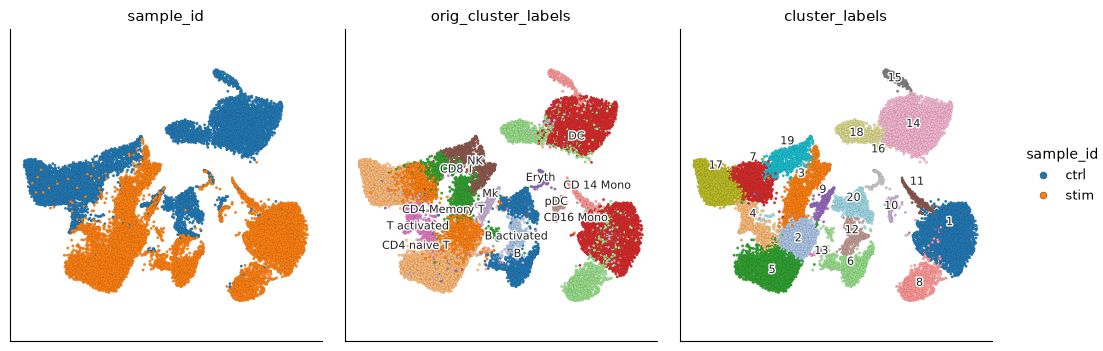
Compare the source labels, the authors’ cell types, and the newly computed clusters on the same UMAP. Agreement between the latter two is useful context when interpreting source separation.
# Compare source labels, imported cell types, and computed clusters.
ds.plots.embedding(
    layout=baseline["umap"],
    color_by=["sample_id", "orig_cluster_labels", baseline["clusters"]],
    n_columns=3,
)
Started: 2026-10-11T18:55:21.721555Z | Wall time: 3.204 s
A table of proportions shows whether each Leiden cluster contains cells from both sources.
# Compare source proportions within each computed cluster.
pd.crosstab(
    baseline.cells.fetch("clusters"),
    baseline.cells.fetch("sample_id"),
    rownames=["cluster"],
    colnames=["source"],
    normalize="index",
).round(3)| source | ctrl | stim |
|---|---|---|
| cluster | ||
| 1 | 0.004 | 0.996 |
| 2 | 0.006 | 0.994 |
| 3 | 0.008 | 0.992 |
| 4 | 0.443 | 0.557 |
| 5 | 0.002 | 0.998 |
| 6 | 0.002 | 0.998 |
| 7 | 0.974 | 0.026 |
| 8 | 0.010 | 0.990 |
| 9 | 0.429 | 0.571 |
| 10 | 0.355 | 0.645 |
| 11 | 0.005 | 0.995 |
| 12 | 0.512 | 0.488 |
| 13 | 0.571 | 0.429 |
| 14 | 0.997 | 0.003 |
| 15 | 0.993 | 0.007 |
| 16 | 0.416 | 0.584 |
| 17 | 0.988 | 0.012 |
| 18 | 0.998 | 0.002 |
| 19 | 0.971 | 0.029 |
| 20 | 0.994 | 0.006 |
Started: 2026-10-11T18:55:24.928027Z | Wall time: 0.143 s
The stimulated sample received interferon beta, and PBMC cell types do not all respond identically to that treatment. Source-associated structure can therefore include biological response as well as technical variation.
The next page, Correcting batch effects with Harmony, uses a different dataset with measured sequencing batches to compare an uncorrected analysis with Harmony. It also introduces metrics for batch mixing. Keep uncorrected counts for condition-level differential expression.