TEA-seq measures RNA, chromatin accessibility, and surface proteins in the same cells. After the two-modality example in Read RNA and protein together with CITE-seq, we now ask whether a joint map retains recognizable populations and how much each modality contributes locally.
Open the prepared result
The data come from Swanson et al. (2021). The prepared store contains 7,069 cells from the GSM5123951 Seurat object. We use the 6,194 cells whose barcodes match the publication’s Figure 4 labels. Of the 6,333 labeled well-W3 cells, 139 are absent from this source object.
# Open count stores and run CyteArc analyses.
import cytearc

# Select explicit fields and display options for plots.
from cytearc.plotting import CellField, FeatureRef

# Keep routine logs and progress bars out of the results.
cytearc.configure_output(level="WARNING", progress=False)

# Download the prepared example store.
dataset = cytearc.cytebase.connect("cytearc_docs").download_dataset(
    "swanson_7K_pbmc_teaseq",
    destination="cytearc_datasets",
    zarr=True,
)

# Open the count store for this analysis.
ds = cytearc.DataStore(f"{dataset}/data.zarr", default_assay="RNA", nthreads=4)

# Inspect the opened store's cells and features.
ds
DataStore has 6194 (7069) cells with 3 assays: ADT ATAC RNA
Cell metadata:
'I', 'ids', 'names', 'ADT_UMAP1', 'ADT_UMAP2',
'ADT_leiden_cluster', 'ADT_nCounts', 'ADT_nFeatures', 'ATAC_UMAP1', 'ATAC_UMAP2',
'ATAC_leiden_cluster', 'ATAC_nCounts', 'ATAC_nFeatures', 'DoubletEnrichment', 'DoubletScore',
'RNA+ATAC+ADT_UMAP1', 'RNA+ATAC+ADT_UMAP2', 'RNA+ATAC+ADT_leiden_cluster', 'RNA+ATAC+ADT_wnn_UMAP1', 'RNA+ATAC+ADT_wnn_UMAP2',
'RNA+ATAC+ADT_wnn_leiden_cluster', 'RNA_UMAP1', 'RNA_UMAP2', 'RNA_leiden_cluster', 'RNA_nCounts',
'RNA_nFeatures', 'TSSEnrichment', 'altius_count', 'altius_frac', 'barcodes',
'batch_id', 'cell_name', 'chip_id', 'gene_bodies_count', 'gene_bodies_frac',
'nCount_ADT', 'nCount_ATAC', 'nCount_RNA', 'nFeature_ADT', 'nFeature_ATAC',
'nFeature_RNA', 'n_duplicate', 'n_fragments', 'n_mito', 'n_unique',
'orig.ident', 'original_barcodes', 'pbmc_sample_id', 'peaks_count', 'peaks_frac',
'publication_barcode', 'tea_cell_type', 'tea_cell_type_color', 'tea_predicted_cell_type', 'tea_prediction_score',
'tss_count', 'tss_frac', 'well_id'
ADT assay has 46 features and following metadata:
'I', 'ids', 'names', 'dropOuts', 'nCells'
ATAC assay has 240122 features and following metadata:
'I', 'ids', 'names', 'dropOuts', 'nCells'
RNA assay has 36601 features and following metadata:
'I', 'ids', 'names', 'dropOuts', 'nCells'Started: 2026-10-11T18:54:53.594265Z | Wall time: 20.872 s
Import and preprocessing are already complete. RNA uses log-transformed library-size normalization, ATAC uses TF-IDF, and ADT uses CLR normalization. All three neighbor results describe the same selected cells.
Compare the separate views
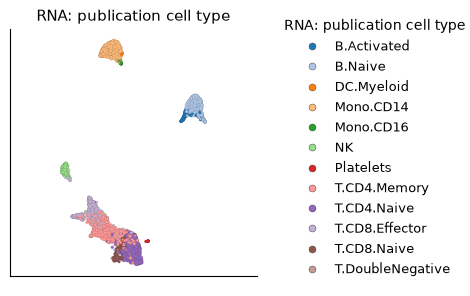
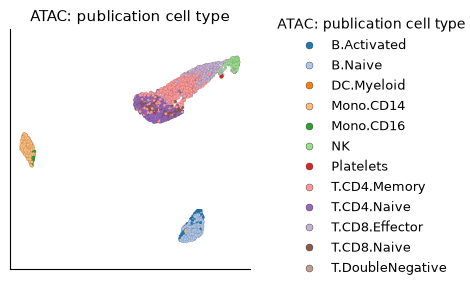
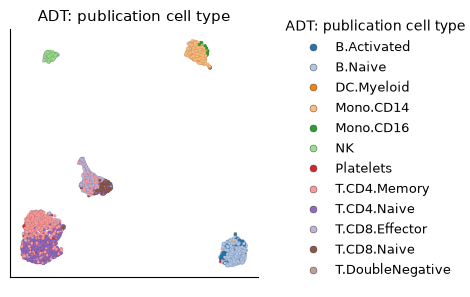
First look for the labeled populations in each modality. Independent UMAPs can rotate and rearrange, so compare population neighborhoods rather than absolute positions or island sizes. A population’s labels and cell count are the same in all three panels.
# Inspect the RNA, ATAC, and protein views in turn.
for assay in ("RNA", "ATAC", "ADT"):

    # Select the saved layout for this assay; require exactly one match.
    layout = ds.artifacts.find("embedding", from_assay=assay, method="umap")

    # Name the modality on its UMAP and color cells by the publication labels.
    ds.plots.embedding(
        layout=layout,
        color_by=CellField("tea_cell_type", label=f"{assay}: publication cell type"),
    )
Started: 2026-10-11T18:55:14.469215Z | Wall time: 3.106 s
Differences between these views may reflect complementary measurements or technical noise. A more compact population is not, by itself, evidence of a better analysis.
Inspect the joint WNN map
Select the saved WNN graph and the UMAP made from it:
# Select the saved WNN graph; require exactly one match.
wnn_graph = ds.artifacts.find("graph", method="wnn")

# Select the saved WNN layout; require exactly one match.
wnn_layout = ds.artifacts.find("embedding", graph=wnn_graph, method="umap")

# Inspect the selected WNN graph and its matching layout.
{"WNN graph": wnn_graph, "WNN layout": wnn_layout}
{'WNN graph': ArtifactRef(datastore, kind='integrated_graph', artifact_id='1e41216fedf4...'),
'WNN layout': ArtifactRef(datastore, kind='embedding', artifact_id='e7a6491edd86...')}Started: 2026-10-11T18:55:17.577957Z | Wall time: 0.015 s
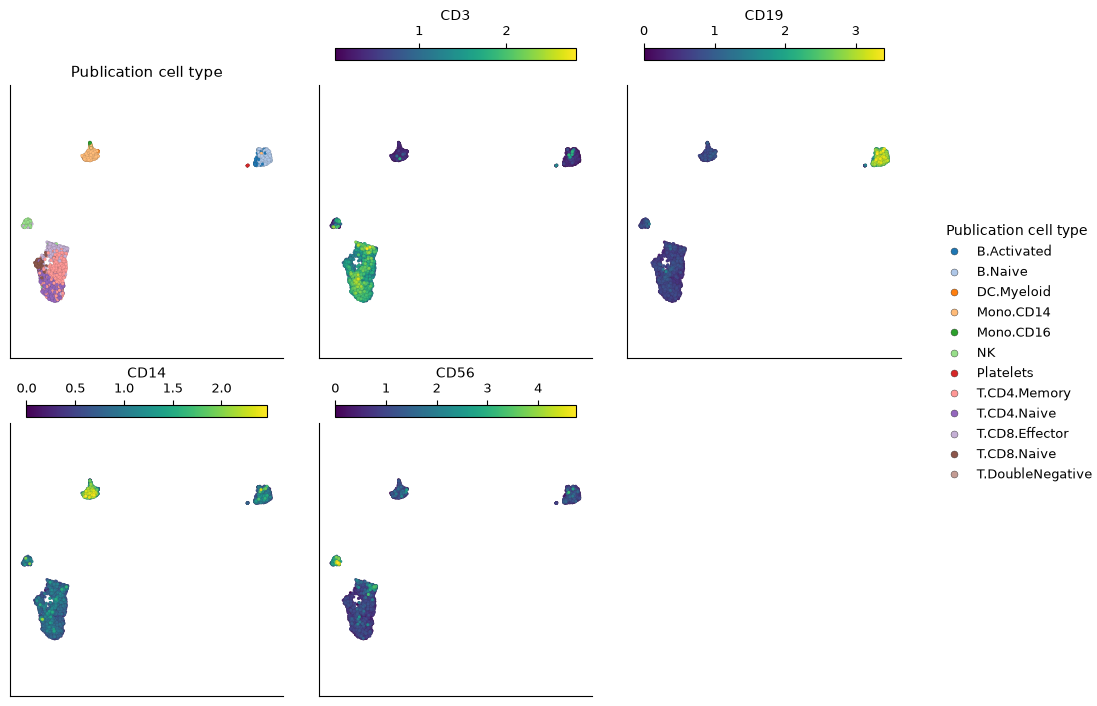
Now compare the publication labels with four measured protein markers on the joint map.
# Compare publication labels with four protein markers on the WNN map.
ds.plots.embedding(
    layout=wnn_layout,
    color_by=[
        CellField("tea_cell_type", label="Publication cell type"),
        FeatureRef("CD3", assay="ADT"),
        FeatureRef("CD19", assay="ADT"),
        FeatureRef("CD14", assay="ADT"),
        FeatureRef("CD56", assay="ADT"),
    ],
    n_columns=3,
    sort_values=True,
)
Started: 2026-10-11T18:55:17.595378Z | Wall time: 2.626 s
CD3, CD19, CD14, and CD56 support T-cell, B-cell, monocyte, and NK-like regions, respectively. Agreement with the publication labels is useful evidence, but does not validate every neighborhood. This UMAP is a CyteArc analysis, not a reproduction of the publication’s layout.
See which modality contributes locally
# Show how much each modality contributes across the joint map.
ds.plots.modality_weights(graph=wnn_graph, layout=wnn_layout)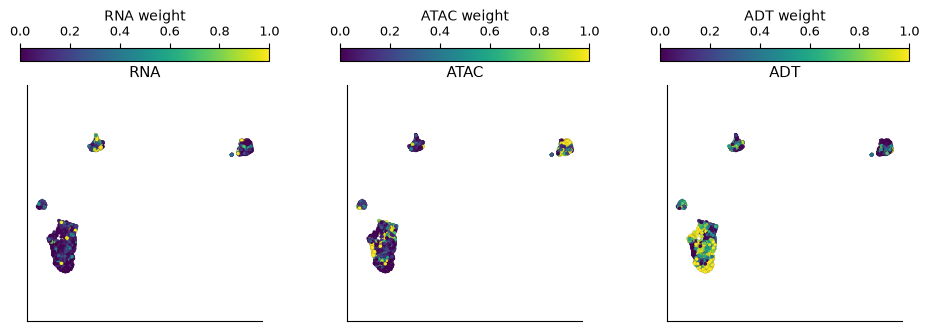
Started: 2026-10-11T18:55:20.223564Z | Wall time: 0.819 s
A high weight means a modality contributes more to that cell’s WNN neighborhood under these preprocessing choices. It does not measure molecular abundance, overall assay quality, or a cause of cell identity. Look for regions where the weights differ, then return to the marker and single-modality maps to interpret those differences.
To check how sensitive the result is to integration choices, continue to Compare multimodal integration methods. The weighting equations and differences from Seurat are covered in Integration and metrics API reference.
- Swanson, E., Lord, C., Reading, J., Heubeck, A. T., Genge, P. C., Thomson, Z., Weiss, M. D., Li, X., Savage, A. K., Green, R. R., Torgerson, T. R., Bumol, T. F., Graybuck, L. T., & Skene, P. J. (2021). Simultaneous trimodal single-cell measurement of transcripts, epitopes, and chromatin accessibility using TEA-seq. eLife, 10. 10.7554/elife.63632