
Fate probabilities say how strongly each cell connects to each endpoint, but not where a lineage runs through the data. This page fits one smooth curve per lineage through the cells’ reduced coordinates, in the spirit of the principal curves of Slingshot, draws the curves over a UMAP, and places points on them. It also builds Slingshot’s cluster tree, which proposes lineages, and shows why its leaves are candidates to check rather than discovered fates.
Open the prepared analysis
# Work with numeric arrays and tables.
import numpy as np
import pandas as pd

# Open count stores and run CyteArc analyses.
import cytearc

# Keep routine logs and progress bars out of the results.
cytearc.configure_output(level="WARNING", progress=False)

# Download the prepared example store.
dataset = cytearc.cytebase.connect("cytearc_docs").download_dataset(
    name="bastidas-ponce_4K_pancreas-d15_rnaseq",
    destination="cytearc_datasets",
    zarr=True,
)

# Open the count store for this analysis.
ds = cytearc.DataStore(f"{dataset}/data.zarr", nthreads=4)

# Open the saved RNA analysis of the pancreas cells.
analysis_run = ds.pipeline.open(label="rna")

# Keep the graph and the full feature selection of the saved analysis.
graph = analysis_run["connectivity_map"]
all_features = analysis_run["feature_universe"]
Started: 2026-10-24T12:58:38.845803Z | Wall time: 8.089 s
Propose lineages with a cluster tree
A cluster tree joins clusters by a minimum spanning tree. Its edge lengths compare cluster centres relative to the clusters’ spread, and the paths from a root cluster to the leaves propose lineages. We build one over the published cell types, rooted at the Ductal cells.
# Read the published cell types of the graph's cells.
annotations = ds.cells.fetch("clusters", key="I")

# Freeze them as labels of the graph's cells.
cell_types = ds.snapshot_cluster_labels(
    "clusters", cell_selection=analysis_run["analysis_cell_selection"]
)

# Join the cell types by a minimum spanning tree rooted at the Ductal cells.
tree_ref = ds.trajectory.lineage_tree(graph, cell_types, root="Ductal")

# Load the tree.
tree = ds.trajectory.load_lineage_tree(tree_ref)

# Print each proposed lineage from the root to a leaf.
for path in tree.lineages:
    print(" > ".join(path))
Ductal > Ngn3 low EP > Ngn3 high EP > Pre-endocrine > Delta
Ductal > Ngn3 low EP > Ngn3 high EP > Pre-endocrine > Beta > Alpha > Epsilon
Started: 2026-10-24T12:58:46.939285Z | Wall time: 0.436 s
The trunk, Ductal to Ngn3 low EP to Ngn3 high EP to Pre-endocrine, follows the known order. The endocrine fates do not: the tree chains Beta, Alpha, and Epsilon one after another. These populations share an endocrine program and lie close together in the reduced space, and a tree must join every cluster, so it runs one lineage through two endpoints. Draw the tree over the saved UMAP:
# Draw the tree with its root and candidate endpoints over the saved UMAP.
ds.plots.lineage_tree(tree=tree_ref, layout=analysis_run["umap"], figsize=(6.0, 5.0))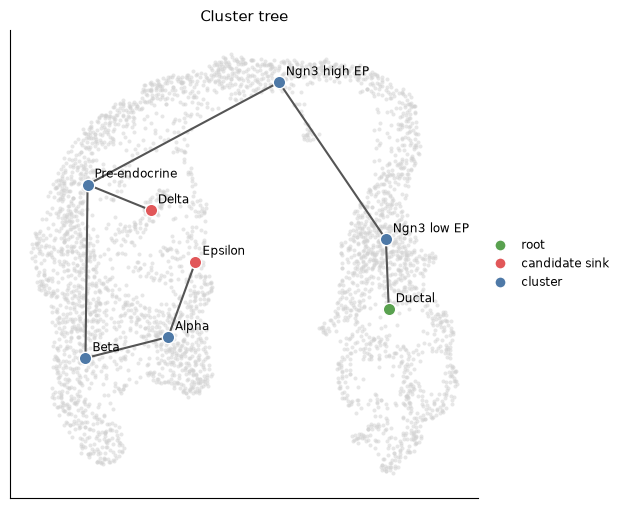
Started: 2026-10-24T12:58:47.379230Z | Wall time: 1.263 s
When the endpoints are known, holding them as ends makes them leaves: the tree first spans the other clusters, then joins each end to its nearest cluster.
# Rebuild the tree with the four endocrine populations held as leaves.
fixed_ref = ds.trajectory.lineage_tree(
    graph, cell_types, root="Ductal", ends=["Alpha", "Beta", "Delta", "Epsilon"]
)

# Print the lineages of the constrained tree.
for path in ds.trajectory.load_lineage_tree(fixed_ref).lineages:
    print(" > ".join(path))
Ductal > Ngn3 low EP > Ngn3 high EP > Pre-endocrine > Alpha
Ductal > Ngn3 low EP > Ngn3 high EP > Pre-endocrine > Beta
Ductal > Ngn3 low EP > Ngn3 high EP > Pre-endocrine > Delta
Ductal > Ngn3 low EP > Ngn3 high EP > Pre-endocrine > Epsilon
Started: 2026-10-24T12:58:48.645539Z | Wall time: 0.380 s
The tree also depends on how finely the cells are clustered. Over the saved analysis’s computed clusters, rooted at the cluster that holds most Ductal cells:
# Read the computed clusters of the saved analysis.
computed = analysis_run.cells.fetch("clusters")

# Name each computed cluster by its most common published cell type.
majority = pd.crosstab(computed, annotations).idxmax(axis=1)

# Root the tree at the cluster that holds most Ductal cells.
root = pd.crosstab(computed, annotations)["Ductal"].idxmax()

# Build the tree over the computed clusters.
computed_tree = ds.trajectory.load_lineage_tree(
    ds.trajectory.lineage_tree(graph, analysis_run["clusters"], root=root)
)

# Print its lineages, naming every cluster by its majority cell type.
for path in computed_tree.lineages:
    print(" > ".join(f"{cluster} ({majority[cluster]})" for cluster in path))
2 (Ductal) > 10 (Ngn3 high EP) > 4 (Ngn3 high EP) > 6 (Pre-endocrine) > 5 (Pre-endocrine) > 1 (Beta) > 3 (Alpha) > 9 (Epsilon)
2 (Ductal) > 8 (Ductal) > 7 (Ductal) > 11 (Ductal)
2 (Ductal) > 10 (Ngn3 high EP) > 4 (Ngn3 high EP) > 6 (Pre-endocrine) > 5 (Pre-endocrine) > 12 (Delta)
Started: 2026-10-24T12:58:49.029133Z | Wall time: 0.444 s
With more clusters, the tree can add leaves that end inside a progenitor population,
such as the Ductal leaf here, because they follow cluster boundaries rather than fates, and it
still chains Beta, Alpha, and Epsilon.
Treat leaves as candidate endpoints and check them with markers, as in Annotate cell types and states, before passing them to trajectory.fate.
Fit fate-weighted lineage curves
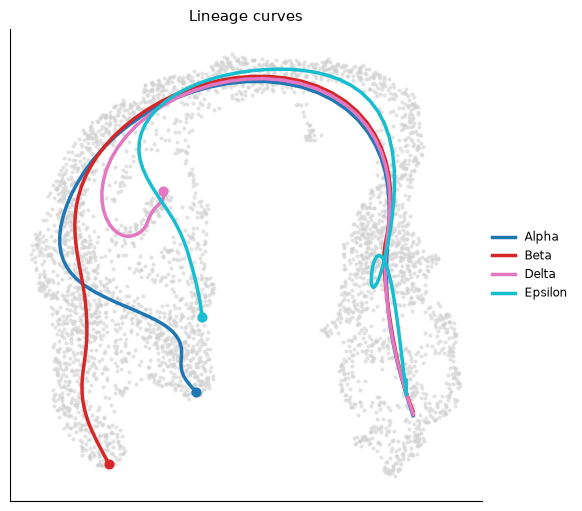
We map the four endocrine fates as in Resolve gene dynamics by lineage. A lineage curve is then the fate-weighted mean of the cells’ coordinates as a smooth function of their pseudotime rank along the lineage: the share of the lineage’s fate weight carried by cells earlier in pseudotime. Cells near an endpoint weigh most in its curve, and cells of the shared trunk shape every curve, so the curves share the trunk and part where the fate probabilities part.
# Name the four candidate endocrine fates.
fates = ["Alpha", "Beta", "Delta", "Epsilon"]

# Mark the starting population and the pooled endpoints.
source = annotations == "Ductal"
sink = np.isin(annotations, fates)

# Share a total weight of -1 among source cells and +1 among endpoint cells.
source_sink_vector = np.zeros(len(annotations), dtype=float)
source_sink_vector[source] = -1.0 / source.sum()
source_sink_vector[sink] = 1.0 / sink.sum()

# Score pseudotime with the chosen source and endpoints.
pseudotime_ref = ds.trajectory.pseudotime(graph, ss_vec=source_sink_vector)

# Keep the selection of the scored cells.
scored_cells = ds.trajectory.load_pseudotime(pseudotime_ref).cell_selection

# Freeze the published cell types of those cells as sink labels.
cell_types = ds.snapshot_cluster_labels("clusters", cell_selection=scored_cells)

# Map how strongly each cell connects to each fate.
fate_ref = ds.trajectory.fate(pseudotime_ref, cell_types, sinks=fates)

# Fit one curve per lineage through the coordinates the graph was built on.
curves_ref = ds.trajectory.curves(fate_ref)

# Draw the curves over the saved UMAP.
ds.plots.lineage_curves(
    curves=curves_ref, layout=analysis_run["umap"], figsize=(6.0, 5.0)
)
Started: 2026-10-24T12:58:49.476210Z | Wall time: 5.068 s
The curves are fitted in the 15 principal components that built the graph. To draw a curve in the UMAP, the cells’ UMAP positions are averaged along the curve with the lineage’s fate weights and smoothed, so the drawing follows where the weighted cells lie in the UMAP. Distances in a UMAP are distorted, so read the drawing for the order and the parting of the lineages, not for lengths.
Read positions along the curves
Every scored cell is projected onto every curve. Its progress is the position of the nearest curve point, from zero at the start to one at the endpoint, and its distance is how far it lies from the curve.
# Load the curves and each cell's position on them.
curves = ds.trajectory.load_curves(curves_ref)

# Tabulate the median progress of each cell type along every lineage.
pd.DataFrame(curves.progress, columns=fates).groupby(annotations).median().round(2)| Alpha | Beta | Delta | Epsilon | |
|---|---|---|---|---|
| Alpha | 0.78 | 0.79 | 0.75 | 1.00 |
| Beta | 0.70 | 0.83 | 0.75 | 0.96 |
| Delta | 0.70 | 0.82 | 0.79 | 0.94 |
| Ductal | 0.11 | 0.13 | 0.12 | 0.21 |
| Epsilon | 0.64 | 0.75 | 0.72 | 0.90 |
| Ngn3 high EP | 0.33 | 0.40 | 0.36 | 0.58 |
| Ngn3 low EP | 0.18 | 0.22 | 0.20 | 0.28 |
| Pre-endocrine | 0.47 | 0.57 | 0.49 | 0.76 |
Started: 2026-10-24T12:58:54.548054Z | Wall time: 0.253 s
Progress grows from the Ductal cells through the progenitors on every lineage. Because progress counts fate weight, an endpoint population fills the last stretch of its own lineage: the Alpha cells carry the last 45% of the Alpha lineage’s weight, so their median is about 0.8. Cells far from a curve land on its nearest end, which is why Alpha cells reach the end of the Epsilon curve. Read progress together with the distance from each curve:
# Tabulate the median distance of each cell type from every curve.
pd.DataFrame(curves.distance, columns=fates).groupby(annotations).median().round(1)| Alpha | Beta | Delta | Epsilon | |
|---|---|---|---|---|
| Alpha | 6.1 | 14.8 | 17.5 | 11.6 |
| Beta | 14.8 | 5.4 | 16.7 | 19.5 |
| Delta | 17.7 | 17.2 | 4.9 | 16.7 |
| Ductal | 7.6 | 7.4 | 7.5 | 7.2 |
| Epsilon | 13.8 | 19.1 | 16.9 | 7.0 |
| Ngn3 high EP | 7.6 | 6.6 | 7.1 | 5.5 |
| Ngn3 low EP | 7.7 | 7.7 | 7.6 | 7.5 |
| Pre-endocrine | 6.7 | 6.1 | 8.6 | 13.3 |
Started: 2026-10-24T12:58:54.803271Z | Wall time: 0.013 s
Ductal and Ngn3 low EP cells lie about equally close to every curve, because the curves share the trunk. From the Pre-endocrine cells on, where the lineages part, the distances differ, and endpoint cells lie much closer to their own lineage’s curve than to the others. Distance is geometric evidence of where a cell lies; unlike a fate probability, it says nothing about where the graph’s random walks lead.
Place other points on the curves
project places any coordinates of the same space on the curves, such as new cells projected
into these principal components with the same loadings. Here we place the centroid of each
cell type.
# Read the coordinates that the curves were fitted in.
coordinates = np.asarray(ds.artifacts.load(curves.coordinates)["data"][:])

# Average the coordinates of each cell type.
centroids = pd.DataFrame(coordinates).groupby(annotations).mean()

# Place each centroid on every curve.
placed = curves.project(centroids.to_numpy())

# Tabulate the fitted pseudotime of each centroid along every lineage.
table = pd.DataFrame(placed.pseudotime, index=centroids.index, columns=fates).round(2)

# Name the curve that each centroid lies closest to.
table["closest curve"] = np.asarray(fates)[placed.distance.argmin(axis=1)]
table| Alpha | Beta | Delta | Epsilon | closest curve | |
|---|---|---|---|---|---|
| Alpha | 0.97 | 0.97 | 0.96 | 0.97 | Alpha |
| Beta | 0.97 | 0.98 | 0.96 | 0.97 | Beta |
| Delta | 0.97 | 0.97 | 0.96 | 0.97 | Delta |
| Ductal | 0.01 | 0.01 | 0.01 | 0.01 | Epsilon |
| Epsilon | 0.97 | 0.96 | 0.96 | 0.96 | Epsilon |
| Ngn3 high EP | 0.50 | 0.50 | 0.50 | 0.50 | Alpha |
| Ngn3 low EP | 0.05 | 0.04 | 0.04 | 0.04 | Delta |
| Pre-endocrine | 0.89 | 0.89 | 0.88 | 0.84 | Beta |
Started: 2026-10-24T12:58:54.819138Z | Wall time: 0.864 s
Each centroid receives the pseudotime of its nearest point on every curve. The progenitor centroids land in order along the shared trunk. Every endpoint centroid lands late on every curve, because pseudotime levels off near the endpoints, but each lies closest to its own lineage’s curve. Near the start the closest curve means little: the curves share the trunk, so the Ductal centroid lies at nearly the same distance from every curve. Coordinates from another dataset need the same reduction: project them with these principal components’ loadings, centring, and scaling first.
Common mistakes and limitations
Treating tree leaves as fates: a tree must join every cluster, so similar endpoints can be chained and extra clusters add leaves. Check leaves with markers before using them as sinks.
Reading a curve as the path of individual cells: a curve summarizes where fate-weighted cells lie, and inside a compact cluster it is an average position.
Measuring along a UMAP drawing: the curves are fitted in the principal components, and the UMAP distorts distances.
Projecting coordinates of another space: points must be reduced the same way as the cells the curves were fitted to.
See Trajectory validation checklist for checks of the endpoints and the graph behind these curves.
- Street, K., Risso, D., Fletcher, R. B., Das, D., Ngai, J., Yosef, N., Purdom, E., & Dudoit, S. (2018). Slingshot: cell lineage and pseudotime inference for single-cell transcriptomics. BMC Genomics, 19(1), 477. 10.1186/s12864-018-4772-0