Do matched rheumatoid arthritis (RA) and control donors differ in gamma-delta T-cell expression of six selected genes? We will average expression within each donor and compare the 18 matched donor pairs with a Wilcoxon signed-rank test.
The donor is the biological replicate. Treating all 1,386 cells as independent replicates would give a misleading sample size, a problem called pseudoreplication. This example compares donor means of normalized expression. For a raw-count pseudobulk model, see Pseudobulk and differential expression (DE) primer.
Prepare the source data
The dataset comes from Binvignat et al. and its CELLxGENE collection. Unlike the prepared PBMC tutorials, this page starts from the full H5AD file. The first run needs network access, several GiB of memory, and space for both the download and a converted Zarr store. Later runs reuse those files.
The preparation below handles the large source once. The statistical workflow starts at Select the matched cells. For background on conversion, see Import and export.
Download and inspect
# Import tools for preparing the dataset and comparing matched donors.
from os import environ
from pathlib import Path
from tempfile import TemporaryDirectory
from urllib.request import urlretrieve

import numpy as np
import pandas as pd

import cytearc
from cytearc.plotting import CellField, StudyDesign

# Keep routine progress messages out of the teaching output.
cytearc.configure_output(level="WARNING", progress=False)

# Choose a local folder for reusable input files.
dataset_directory = Path(environ.get("CYTEARC_DOCS_DATA_DIR", "cytearc_datasets"))

# Create the local folder if it does not already exist.
dataset_directory.mkdir(parents=True, exist_ok=True)

# Name the local H5AD download.
h5ad_path = dataset_directory / "binvignat_ra_pbmc.h5ad"

# Name the reusable converted count store.
source_store = dataset_directory / "binvignat_ra_pbmc.zarr"
Started: 2026-10-11T18:54:43.385262Z | Wall time: 1.809 s
Download to a temporary filename so an interrupted download is not mistaken for a complete H5AD file.
# Reuse completed local work when it is already present.
if not h5ad_path.exists():

    # Use a temporary filename until the download finishes.
    partial_path = h5ad_path.with_suffix(".h5ad.part")

    # Download the complete input file to the temporary filename.
    urlretrieve(
        "https://datasets.cellxgene.cziscience.com/3b751975-34bb-409a-a9b7-98380f0450ea.h5ad",
        partial_path,
    )

    # Move the completed file or store to its reusable path.
    partial_path.replace(h5ad_path)

# Inspect the available count matrix before conversion.
inspection = cytearc.inspect_h5ad(str(h5ad_path))

# Verify that the count matrix is stored at raw/X.
assert inspection.matrixKey == "raw/X"

# Verify that the matrix contains integer-like counts.
assert inspection.integerLike is True

# Verify the published cell and gene counts.
assert (inspection.nCells, inspection.nFeatures) == (108_717, 21_648)

# Show the selected matrix and its cell and gene counts.
inspection.matrixKey, inspection.nCells, inspection.nFeatures
('raw/X', 108717, 21648)Started: 2026-10-11T18:54:45.196827Z | Wall time: 7.075 s
This file stores counts in raw/X. Inspection identifies that matrix before conversion,
so we do not accidentally analyze the other expression matrix in X.
Convert and open a working store
Conversion uses a 6 GiB budget because the planned count layout needs about 5 GB. The finished store is moved into place only after conversion succeeds.
# Reuse completed local work when it is already present.
if not source_store.exists():

    # Stage conversion in a temporary folder before publishing the completed store.
    with TemporaryDirectory(dir=dataset_directory) as conversion_directory:

        # Convert into a temporary store until every write succeeds.
        staged_store = Path(conversion_directory) / source_store.name

        # Read the count matrix and its cell and feature identifiers.
        reader = cytearc.H5adReader.from_inspect(inspection)

        # Ensure the input reader is closed even if conversion fails.
        try:

            # Write the prepared counts and metadata to the new store.
            cytearc.H5adToZarr(
                reader,
                zarr_loc=str(staged_store),
                assay_name="RNA",
                nthreads=4,
                mem_budget="6G",
            ).dump()
        finally:

            # Close the H5AD reader after conversion.
            reader.h5.close()

        # Move the completed file or store to its reusable path.
        staged_store.replace(source_store)
Started: 2026-10-11T18:54:52.274421Z | Wall time: 23.802 s
Keep the published cohort with min_features_per_cell=0, which drops only cells without
detected features (none here). Mounting puts the new selection and test results in a temporary
working store while leaving the count matrix in its reusable source store.
# Open the source without dropping cells before selecting the cohort.
source = cytearc.DataStore(
    str(source_store), default_assay="RNA", min_features_per_cell=0, nthreads=4
)

# Check that initialization retained all published cells.
assert source.cells.N == 108_717

# Check the initialized count matrix dimensions.
{"cells": source.cells.N, "genes": source.RNA.feats.N}
{'cells': 108717, 'genes': 21648}Started: 2026-10-11T18:55:16.080057Z | Wall time: 3.369 s
Keep new selections and test results in a separate working store.
# Keep new analysis results in a temporary working folder.
analysis_directory = TemporaryDirectory()

# Open the datastore for the following analysis.
ds = cytearc.mount_datastore(
    str(source_store),
    at=str(Path(analysis_directory.name) / "condition_analysis.zarr"),
    default_assay="RNA",
    min_features_per_cell=0,
    nthreads=4,
)

# Check that mounting preserved the source dimensions.
{
    "same cell count": ds.cells.N == source.cells.N,
    "same gene count": ds.RNA.feats.N == source.RNA.feats.N,
}
{'same cell count': True, 'same gene count': True}Started: 2026-10-11T18:55:19.451409Z | Wall time: 2.011 s
Select the matched cells
The publication calls gamma-delta T cells yd T cells in fine_annot.
pair_index_CW identifies matched RA-control pairs. Keep cells with that annotation
and a recorded pair, then save the selection for both the test and plot.
# Keep a consistent order for control and rheumatoid arthritis.
GROUPS = ["normal", "rheumatoid arthritis"]

# Read the published fine cell-type labels.
fine_annotation = np.asarray(ds.cells.fetch_all("fine_annot"), dtype=object)

# Read the matched-pair identifier for each cell.
pair_index = np.asarray(ds.cells.fetch_all("pair_index_CW"), dtype=float)

# Keep gamma-delta T cells with a recorded matched pair.
matched_gamma_delta = np.isfinite(pair_index) & (fine_annotation == "yd T cells")

# Save the values in cell metadata using the stated selection.
ds.cells.insert("matched_yd_t_cells", matched_gamma_delta, overwrite=True)

# Freeze the selected cells for both the statistical test and plot.
cells = ds.snapshot_cell_selection("matched_yd_t_cells")

# Check how many cells were retained for the paired analysis.
{"selected cells": int(matched_gamma_delta.sum()), "total cells": ds.cells.N}
{'selected cells': 1386, 'total cells': 108717}Started: 2026-10-11T18:55:21.466187Z | Wall time: 0.104 s
Before testing, check that each donor belongs to one condition and one pair. Each pair must contain one donor from each condition.
# Read the donor identity for each cell.
donor_id = np.asarray(ds.cells.fetch_all("donor_id"), dtype=object)

# Read each cell's biological condition.
disease = np.asarray(ds.cells.fetch_all("disease"), dtype=object)

# Reduce the selected metadata to one row per donor and pair.
donor_design = pd.DataFrame(
    {
        "donor_id": donor_id[matched_gamma_delta],
        "disease": disease[matched_gamma_delta],
        "pair_index_CW": pair_index[matched_gamma_delta],
    }
).drop_duplicates()

# Check the selected gamma-delta T-cell count.
assert int(matched_gamma_delta.sum()) == 1_386

# Require one design row per selected donor.
assert len(donor_design) == donor_design["donor_id"].nunique() == 36

# Require the expected 18 matched pairs.
assert donor_design["pair_index_CW"].nunique() == 18

# Require both comparison conditions in the selected design.
assert set(donor_design["disease"]) == set(GROUPS)

# Inspect the first four donor pairs and their disease labels.
donor_design.sort_values(["pair_index_CW", "disease"]).head(8)| donor_id | disease | pair_index_CW | |
|---|---|---|---|
| 83 | Control01_1_A_M | normal | 1.0 |
| 15 | RA01_1_A_M | rheumatoid arthritis | 1.0 |
| 102 | Control03_1_C_F | normal | 3.0 |
| 68 | RA03_1_C_F | rheumatoid arthritis | 3.0 |
| 36 | Control04_1_C_F | normal | 4.0 |
| 476 | RA04_1_C_F | rheumatoid arthritis | 4.0 |
| 171 | Control05_1_C_M | normal | 5.0 |
| 65 | RA05_1_C_M | rheumatoid arthritis | 5.0 |
Started: 2026-10-11T18:55:21.572507Z | Wall time: 0.066 s
# Count donors and conditions within each matched pair.
pair_balance = donor_design.groupby("pair_index_CW", observed=True).agg(
    donors=("donor_id", "nunique"), conditions=("disease", "nunique")
)

# Require two donors in every matched pair.
assert pair_balance["donors"].eq(2).all()

# Require one donor from each condition in every pair.
assert pair_balance["conditions"].eq(2).all()

# Count the biological replicates in each condition.
donor_design.groupby("disease", observed=True).size().rename("donors")
disease
normal 18
rheumatoid arthritis 18
Name: donors, dtype: int64Started: 2026-10-11T18:55:21.640776Z | Wall time: 0.014 s
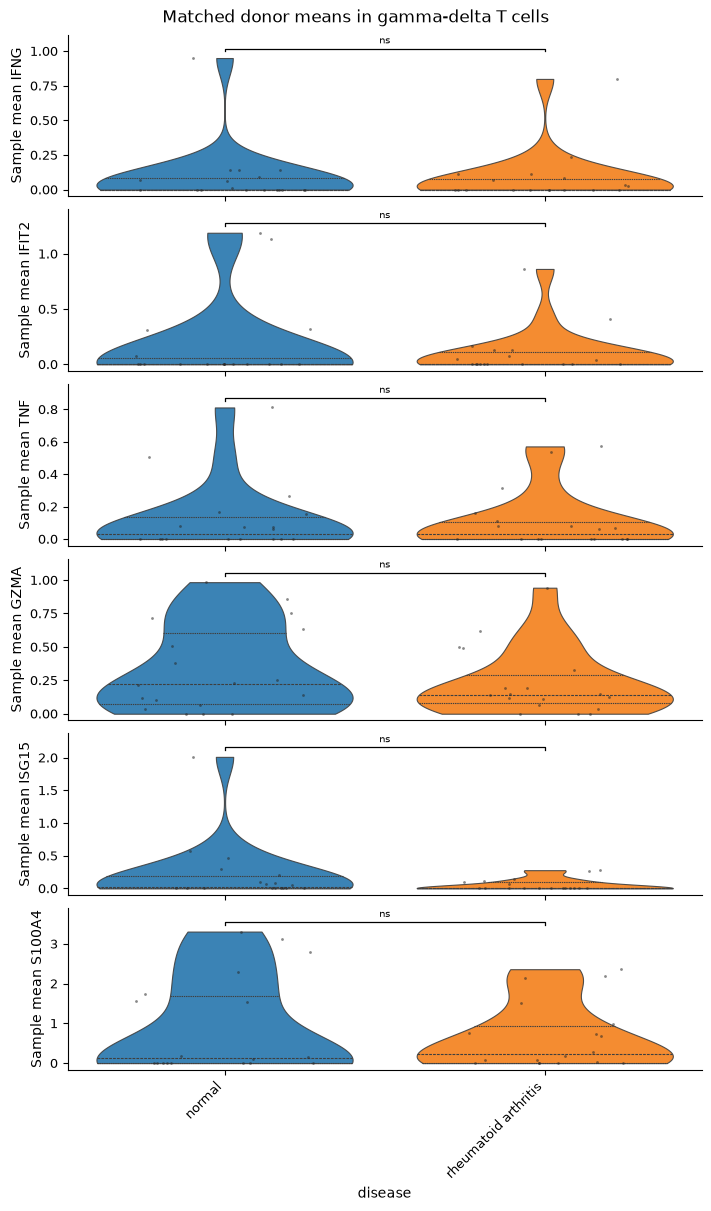
We have 1,386 cells from 36 donors in 18 matched pairs. Those 18 pairs, not the number of cells, determine the replication for the test.
Test a small gene panel
StudyDesign records which column identifies donors, conditions, and matched pairs.
We use the same design again for the plot. CyteArc averages normalized expression within
donors by default, then aligns the pairs for a two-sided signed-rank test.
# Choose the six genes for this exploratory comparison.
panel = ["IFNG", "IFIT2", "TNF", "GZMA", "ISG15", "S100A4"]

# Use disease metadata to define the comparison groups.
condition = CellField("disease")

# Declare the donor, condition, and matched-pair columns.
design = StudyDesign(
    sample_by="donor_id", condition_by="disease", pair_by="pair_index_CW"
)
Started: 2026-10-11T18:55:21.657212Z | Wall time: 0.005 s
Run the paired comparison on donor means.
# Compare paired donor means with the Wilcoxon signed-rank test.
paired_result = ds.compare.test(
    panel,
    condition,
    cell_selection=cells,
    groups=GROUPS,
    study_design=design,
    test="wilcoxon",
)
Started: 2026-10-11T18:55:21.664552Z | Wall time: 2.227 s
The default Benjamini-Hochberg correction covers all six tests together. Read the adjusted p-values alongside the donor distributions, rather than looking only for a threshold crossing.
# Combine the per-gene tests into one results table.
panel_table = pd.concat(
    {gene: paired_result.tables[gene] for gene in panel}, names=["gene"]
).reset_index(level="gene")

# Inspect pair counts and adjusted p-values for the six genes.
panel_table[["gene", "n_pairs", "statistic", "p_value", "p_value_adjusted"]]| gene | n_pairs | statistic | p_value | p_value_adjusted | |
|---|---|---|---|---|---|
| 0 | IFNG | 18 | 39.0 | 1.000000 | 1.0000 |
| 0 | IFIT2 | 18 | 26.0 | 0.878482 | 1.0000 |
| 0 | TNF | 18 | 57.0 | 0.864705 | 1.0000 |
| 0 | GZMA | 18 | 63.0 | 0.346550 | 0.6931 |
| 0 | ISG15 | 18 | 13.0 | 0.139414 | 0.6931 |
| 0 | S100A4 | 18 | 35.0 | 0.271948 | 0.6931 |
Started: 2026-10-11T18:55:23.894150Z | Wall time: 0.012 s
View the donor distributions
Each plotted point is a donor mean. The plot reads the saved test results for its brackets, so the displayed statistics come from the same comparison. Give the six rows enough space and enlarge the points so individual donors remain visible.
# Compare distributions within the stated groups.
ds.plots.distribution(
    panel,
    grouping=condition,
    cell_selection=cells,
    groups=GROUPS,
    study_design=design,
    kind="stacked_violin",
    figsize=(7, 12),
    point_size=2.0,
    point_alpha=0.55,
    share_y=False,
    stats_results=paired_result,
    stats_show_p=False,
    title="Matched donor means in gamma-delta T cells",
)
Started: 2026-10-11T18:55:23.908855Z | Wall time: 4.213 s
Compare RA and control within each gene’s row because the rows have separate value scales. The plot does not join matched donors with lines, although pairing is used in the test. None of these six comparisons passes an adjusted p-value threshold of 0.05 in this example.
Interpret the scope of the result
This donor-mean test does not reproduce the paper’s count-model pseudobulk analysis. The approaches summarize expression differently and make different statistical assumptions. A nonsignificant result here does not establish that the conditions are identical, nor does it tell us by itself why a difference was not detected.
Donors with few selected cells may have less precise means. This simple test does not model that uncertainty separately.
Matching does not remove all confounding. One selected pair spans batches 2 and 3, and this test has no batch term to separate that contribution.
This is a six-gene exploratory panel. Do not generalize its result to every gene or gamma-delta T-cell state.
For count-model analysis with a sample design, continue to Pseudobulk and differential expression (DE) primer.
- Binvignat, M., Miao, B. Y., Wibrand, C., Yang, M. M., Rychkov, D., Flynn, E., Nititham, J., Tamaki, W., Khan, U., Carvidi, A., Krueger, M., Niemi, E., Sun, Y., Fragiadakis, G. K., Sellam, J., Mariotti-Ferrandiz, E., Klatzmann, D., Gross, A. J., Ye, C. J., … Sirota, M. (2024). Single-cell RNA-Seq analysis reveals cell subsets and gene signatures associated with rheumatoid arthritis disease activity. JCI Insight, 9(16). 10.1172/jci.insight.178499