This page annotates the clusters of a small public dataset, 2,700 peripheral blood mononuclear cells (PBMCs) from 10x Genomics, starting from a fresh Python session. The preprocessing runs locally in a few minutes; the annotation itself runs on CyteType’s servers. The outputs on this page come from a real run of this notebook.
Before you start, you need:
Python 3.12 or newer with CyteType and Scanpy installed, for example with
pip install cytetype "scanpy[leiden]"(see Installation).A CyteType sign-in on this machine. Run
cytetype setuponce in a terminal (see Sign in and API keys).
Working in R? The same workflow with Seurat is in the R quickstart.
Load and cluster the data
CyteType annotates the clusters you define, using the marker genes you compute for them. These are the standard Scanpy steps: quality control, normalization, clustering and marker detection.
# Import Scanpy for preprocessing and CyteType for annotation.
import scanpy as sc

from cytetype import CyteType, marker_dotplot

# Use a consistent figure resolution for the plots below.
sc.set_figure_params(dpi=100, frameon=False)
Started: 2026-10-18T09:26:00.316829Z | Wall time: 1.164 s
# Download the 10x Genomics PBMC 3k dataset with raw counts.
adata = sc.datasets.pbmc3k()
adataAnnData object with n_obs × n_vars = 2700 × 32738
var: 'gene_ids'Started: 2026-10-18T09:26:01.481775Z | Wall time: 1.306 s
# Remove cells with few detected genes and genes detected in very few cells.
sc.pp.filter_cells(adata, min_genes=200)
sc.pp.filter_genes(adata, min_cells=3)

# Drop cells with a high fraction of mitochondrial reads.
adata.var["mt"] = adata.var_names.str.startswith("MT-")
sc.pp.calculate_qc_metrics(adata, qc_vars=["mt"], percent_top=None, log1p=False, inplace=True)
adata = adata[adata.obs["pct_counts_mt"] < 5].copy()

# Keep the raw counts in a layer; CyteType uploads them with the normalized data.
adata.layers["counts"] = adata.X.copy()

# Normalize and log-transform; CyteType expects log-normalized values in adata.X.
sc.pp.normalize_total(adata, target_sum=1e4)
sc.pp.log1p(adata)
Started: 2026-10-18T09:26:02.789262Z | Wall time: 1.919 s
# Find highly variable genes, reduce dimensions and build the neighbor graph.
sc.pp.highly_variable_genes(adata, n_top_genes=2000)
sc.tl.pca(adata, mask_var="highly_variable")
sc.pp.neighbors(adata, n_neighbors=10, n_pcs=40)

# Cluster with Leiden and compute a UMAP for plotting and for the report.
sc.tl.leiden(adata, resolution=0.8, flavor="igraph", n_iterations=2, key_added="leiden")
sc.tl.umap(adata)
Started: 2026-10-18T09:26:04.709565Z | Wall time: 12.039 s
# Rank marker genes for each cluster; CyteType reads them from adata.uns.
sc.tl.rank_genes_groups(adata, groupby="leiden", method="wilcoxon", key_added="rank_genes_leiden")
Started: 2026-10-18T09:26:16.749572Z | Wall time: 0.631 s
Prepare the annotation
CyteType checks the inputs and summarizes each cluster: its top marker genes, how widely genes
are expressed, and the cell metadata. It also writes two files to the working directory,
vars.h5 (expression) and obs.duckdb (cell metadata and UMAP coordinates), which are uploaded
with the job. Prepare your data explains each requirement.
# Check the inputs and build the files that are uploaded with the job.
annotator = CyteType(adata, group_key="leiden", rank_key="rank_genes_leiden")
Auto-detected gene symbols in adata.var_names (index) (0% ID-like, 100% unique).
Using coordinates from 'X_umap' for visualization.
Materialized canonical gene symbols in temporary column '__cytetype_gene_symbols' from adata.var_names.
Extracting marker genes...
Aggregating cluster metadata...
Writing obs data to duckdb artifact...
Data preparation completed. Ready for submitting jobs.
Started: 2026-10-18T09:26:17.383132Z | Wall time: 0.438 s
Run the annotation
run() uploads the files, submits the job and waits for the results. The report link is printed
as soon as the job starts, so you can follow its progress in the browser. If your session ends
before the job finishes, the job keeps running and you can fetch the results later (see
Run, monitor and rerun jobs).
The study context tells CyteType what the sample is. Include the organism, tissue and condition; Study context and metadata has more examples.
# Describe the study, submit the job and wait for it to finish.
adata = annotator.run(
    study_context=(
        "Peripheral blood mononuclear cells (PBMCs) from a healthy human donor, "
        "profiled with 10x Genomics 3' single-cell RNA-seq."
    ),
    metadata={"title": "PBMC 3k quickstart"},
)
Uploading vars.h5 artifact...
Uploading obs.duckdb artifact...
CyteType job submitted.
If your session disconnects, results can still be fetched later with:
`results = annotator.get_results()`
[TRACK PROGRESS]
https://cytetype.nygen.io/report/a1a55802-b137-4617-aab0-9a6fe65af05e
[DONE] CyteType job completed.✓ Job a1a55802-b137-4617-aab0-9a6fe65af05e completed successfully.
     Annotation labels → adata.obs['cytetype_annotation_leiden']
   Cell Ontology terms → adata.obs['cytetype_cellOntologyTerm_leiden']
Cell Ontology term IDs → adata.obs['cytetype_cellOntologyTermID_leiden']
           Cell states → adata.obs['cytetype_cellState_leiden']
   Reviewer confidence → adata.obs['cytetype_reviewerConfidence_leiden']
          Full results → adata.uns['cytetype_results']
Report:
https://cytetype.nygen.io/report/a1a55802-b137-4617-aab0-9a6fe65af05e
Started: 2026-10-18T09:26:17.822558Z | Wall time: 472.362 s
Explore the results
Every cell now carries its cluster’s annotation in adata.obs: the cell type label, its Cell
Ontology term and ID, the cell state and the reviewer’s confidence.
# Show one row per cluster with its label, Cell Ontology term ID and reviewer confidence.
columns = [
    "leiden",
    "cytetype_annotation_leiden",
    "cytetype_cellOntologyTermID_leiden",
    "cytetype_reviewerConfidence_leiden",
]
adata.obs[columns].drop_duplicates().sort_values("leiden").reset_index(drop=True)| leiden | cytetype_annotation_leiden | cytetype_cellOntologyTermID_leiden | cytetype_reviewerConfidence_leiden | |
|---|---|---|---|---|
| 0 | 0 | CD8+ effector memory T cell | CL:0000909 | High |
| 1 | 1 | Naive B cell | CL:0000788 | High |
| 2 | 2 | CD4+ conventional T cell | CL:0000624 | Moderate |
| 3 | 3 | Classical monocyte | CL:0000860 | High |
| 4 | 4 | CD56-dim NK cell | CL:0000939 | High |
| 5 | 5 | Non-classical monocyte | CL:0000875 | Moderate |
| 6 | 6 | Naive CD4+ T cell | CL:0000895 | Moderate |
| 7 | 7 | Dendritic cell | CL:0000451 | Moderate |
| 8 | 8 | Platelet | CL:0000233 | High |
Started: 2026-10-18T09:34:10.189276Z | Wall time: 0.039 s
# Plot the CyteType labels on the UMAP.
sc.pl.umap(adata, color="cytetype_annotation_leiden", title="CyteType annotation")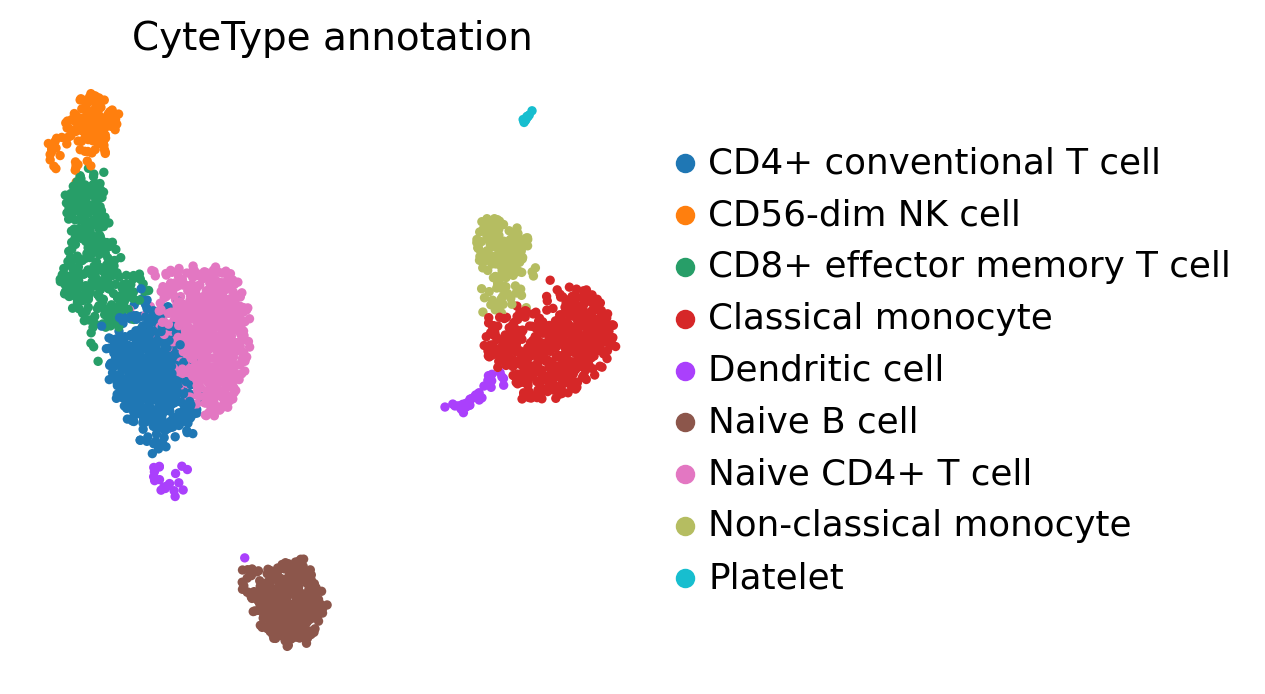
Started: 2026-10-18T09:34:10.233725Z | Wall time: 0.548 s
# Show the marker genes that support each label, grouped by cell type.
marker_dotplot(adata, group_key="leiden")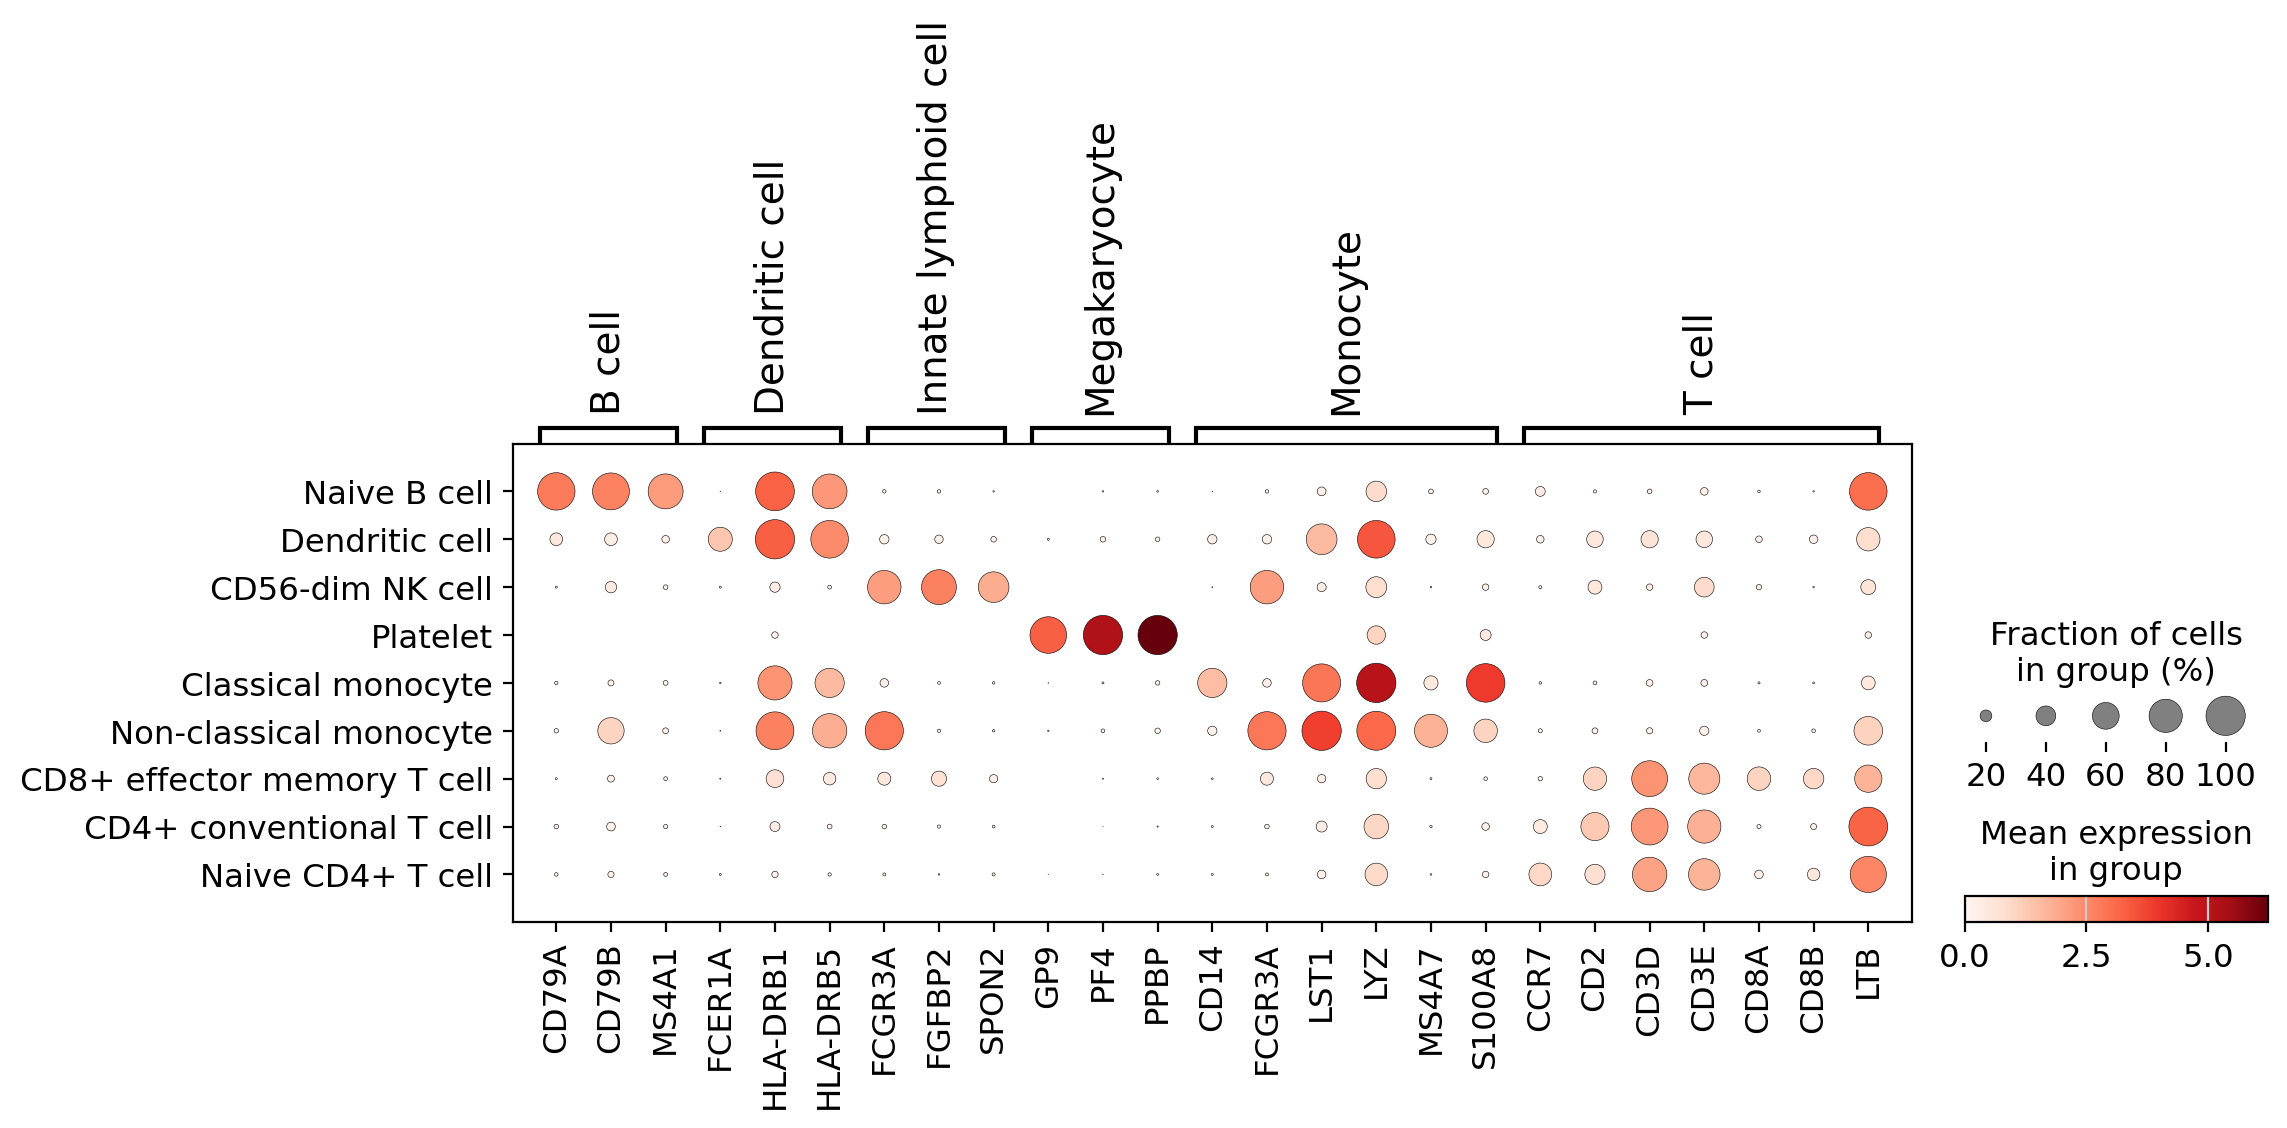
Started: 2026-10-18T09:34:10.786011Z | Wall time: 0.762 s
Read the evidence
get_results() returns the full results, including the evidence behind each label. Each entry
in annotations describes one cluster.
# Look at the evidence recorded for the first cluster.
results = annotator.get_results()
first = results["annotations"][0]
{key: first[key] for key in ("clusterId", "annotation", "cellState", "reviewerConfidence", "supportingMarkers")}
Retrieving results with prefix: 'cytetype'
{'clusterId': '0',
 'annotation': 'CD8+ effector memory T cell',
 'cellState': 'Cytotoxic Effector Program',
 'reviewerConfidence': 'High',
 'supportingMarkers': ['CD8A',
  'CD8B',
  'CD3D',
  'KLRG1',
  'HOPX',
  'SAMD3',
  'FGFBP2',
  'GZMK',
  'CCL5',
  'CST7',
  'PRF1',
  'NKG7']}
Started: 2026-10-18T09:34:11.552476Z | Wall time: 0.023 s
The interactive report holds the full reasoning for every cluster: the candidate cell types that were considered, the marker evidence, quality-control checks and pathway context. The report for this example is public; your own reports are private unless you share them (see Visibility and sharing).
# Get the link to the interactive report.
adata.uns["cytetype_jobDetails"]["report_url"]'https://cytetype.nygen.io/report/a1a55802-b137-4617-aab0-9a6fe65af05e'Started: 2026-10-18T09:34:11.580426Z | Wall time: 0.011 s
Save and clean up
The results are stored in adata.obs and adata.uns, so they are saved with the AnnData file.
cleanup() deletes the upload files and the helper column that CyteType added to adata.var.
# Remove the upload files and the temporary helper column.
annotator.cleanup()

# Save the annotated data; the CyteType results are saved with it.
adata.write_h5ad("pbmc3k_cytetype.h5ad")
Deleted artifact file: vars.h5
Deleted artifact file: obs.duckdb
Deleted temporary canonical gene-symbol column '__cytetype_gene_symbols'.
Started: 2026-10-18T09:34:11.596663Z | Wall time: 0.349 s
Next steps
Prepare your data: requirements for clusters, marker genes and gene symbols.
The CyteType report: every section of the report.
Results in AnnData and Seurat: all columns and keys.
Interpret and review results: confidence, heterogeneity and limits.
Use your own LLM: run CyteType with your own model provider.